Welcome to the Arrived Q1 2022 financial review! We’ll review the 76 Arrived properties that had rental operations in the 1st quarter.
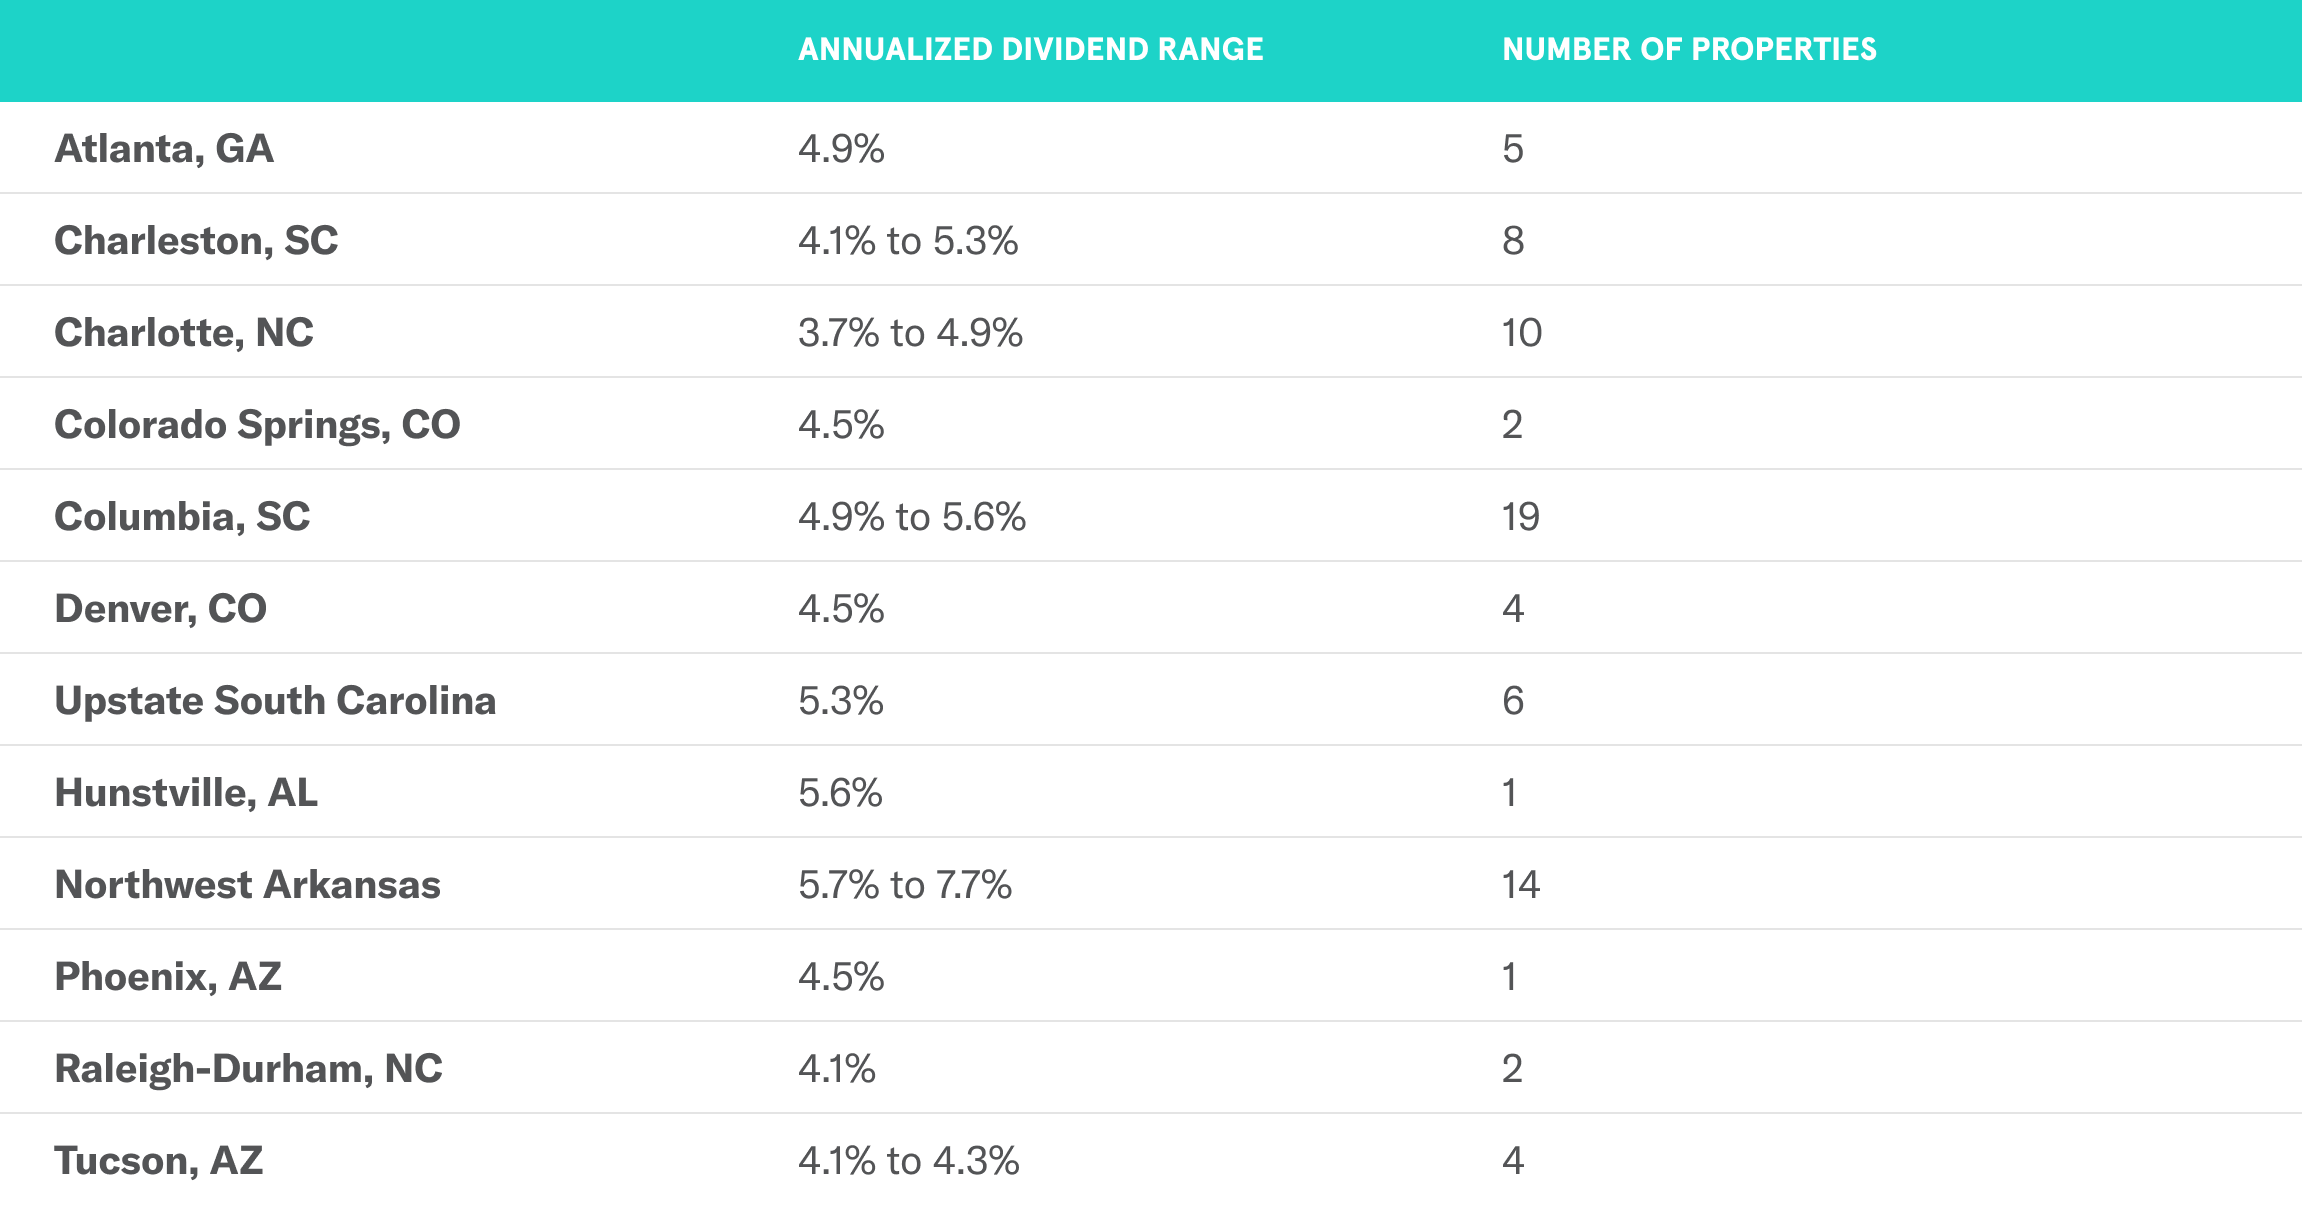
These 76 properties paid out a total of $122,467! The annualized dividends ranged from 3.7% to 7.7% depending on the property.
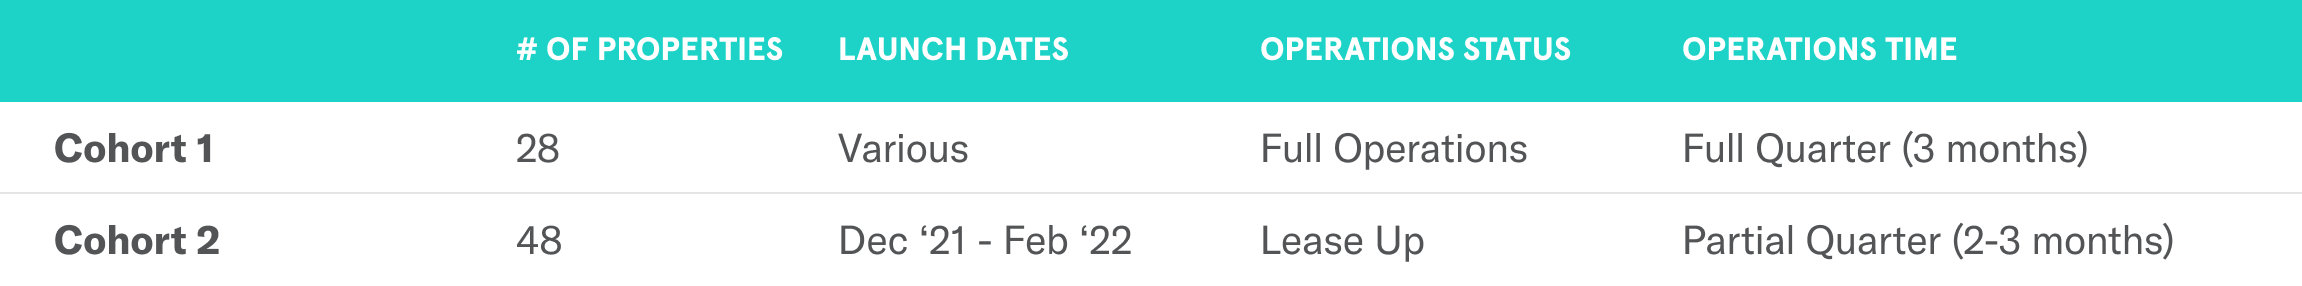
In order to fairly assess the properties, we’ll cohort the properties up by how long they have been operational. There are 28 properties that investors owned before January 1st that had a full 3 months of operations in Q1. These properties are largely stabilized, meaning that they’ve already been acquired, done their initial improvements, and been leased up.
There are 40 properties investors purchased in December and January which had a full 3 months of ramping up operations. The remaining 8 properties have been owned by investors for 2 months of the first quarter. The properties have already been acquired, but are largely still under going improvements and finding their first tenants.
Cohort 1: 28 properties, full quarter of stabilized rental operations
Cohort 2: 40 properties, purchased by investors in Dec/January, started rental operations + 8 properties purchased by investors in February that just started operations. Properties are mostly in the improvements and lease-up phase of the investment.
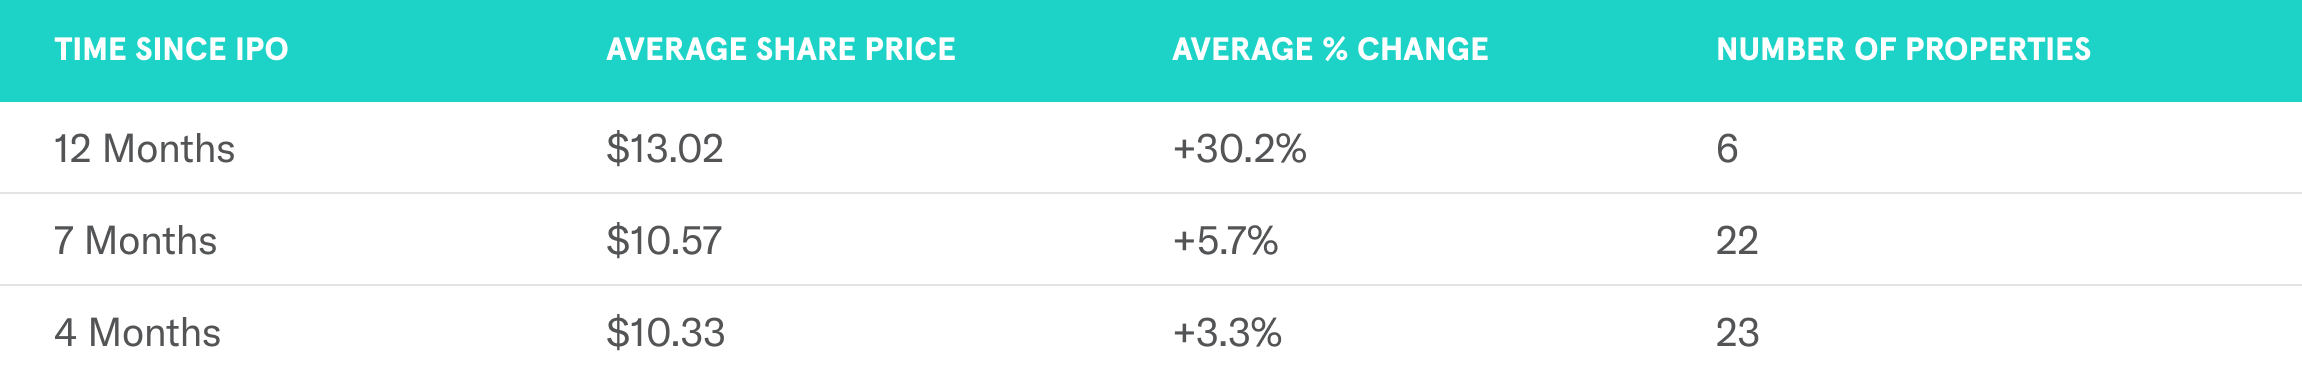
Q1 is also the first update of our quarterly Arrived Share Prices! You can check out this article to learn more, but now there’s a way to see the appreciation on the properties as well as the dividend income.
Occupancy
Of the 76 properties, 28 were purchased by investors prior to Q1. Those properties have an overall occupancy rate of 96%, which is excellent!
The other 48 properties were purchased by investors in Q1. When investors fund a property, there’s generally at least a few weeks and up to 2-3 months required for the initial closing, upfront renovations, and securing the first tenant. By doing some immediate improvements to the properties, we’re able to increase its value and the rent we can achieve.
Those 48 properties are 50% occupied at the end of the quarter. January and February are notoriously tough leasing months, and activity picked up sharply after the quarter. In fact, As of April 30th the occupancy rate for this cohort has already climbed to 73%, and it will continue to climb over the coming weeks.
With the renovations completed, rental listings up, and the warm spring leasing season coming, all properties should be leased up soon.
Dividends
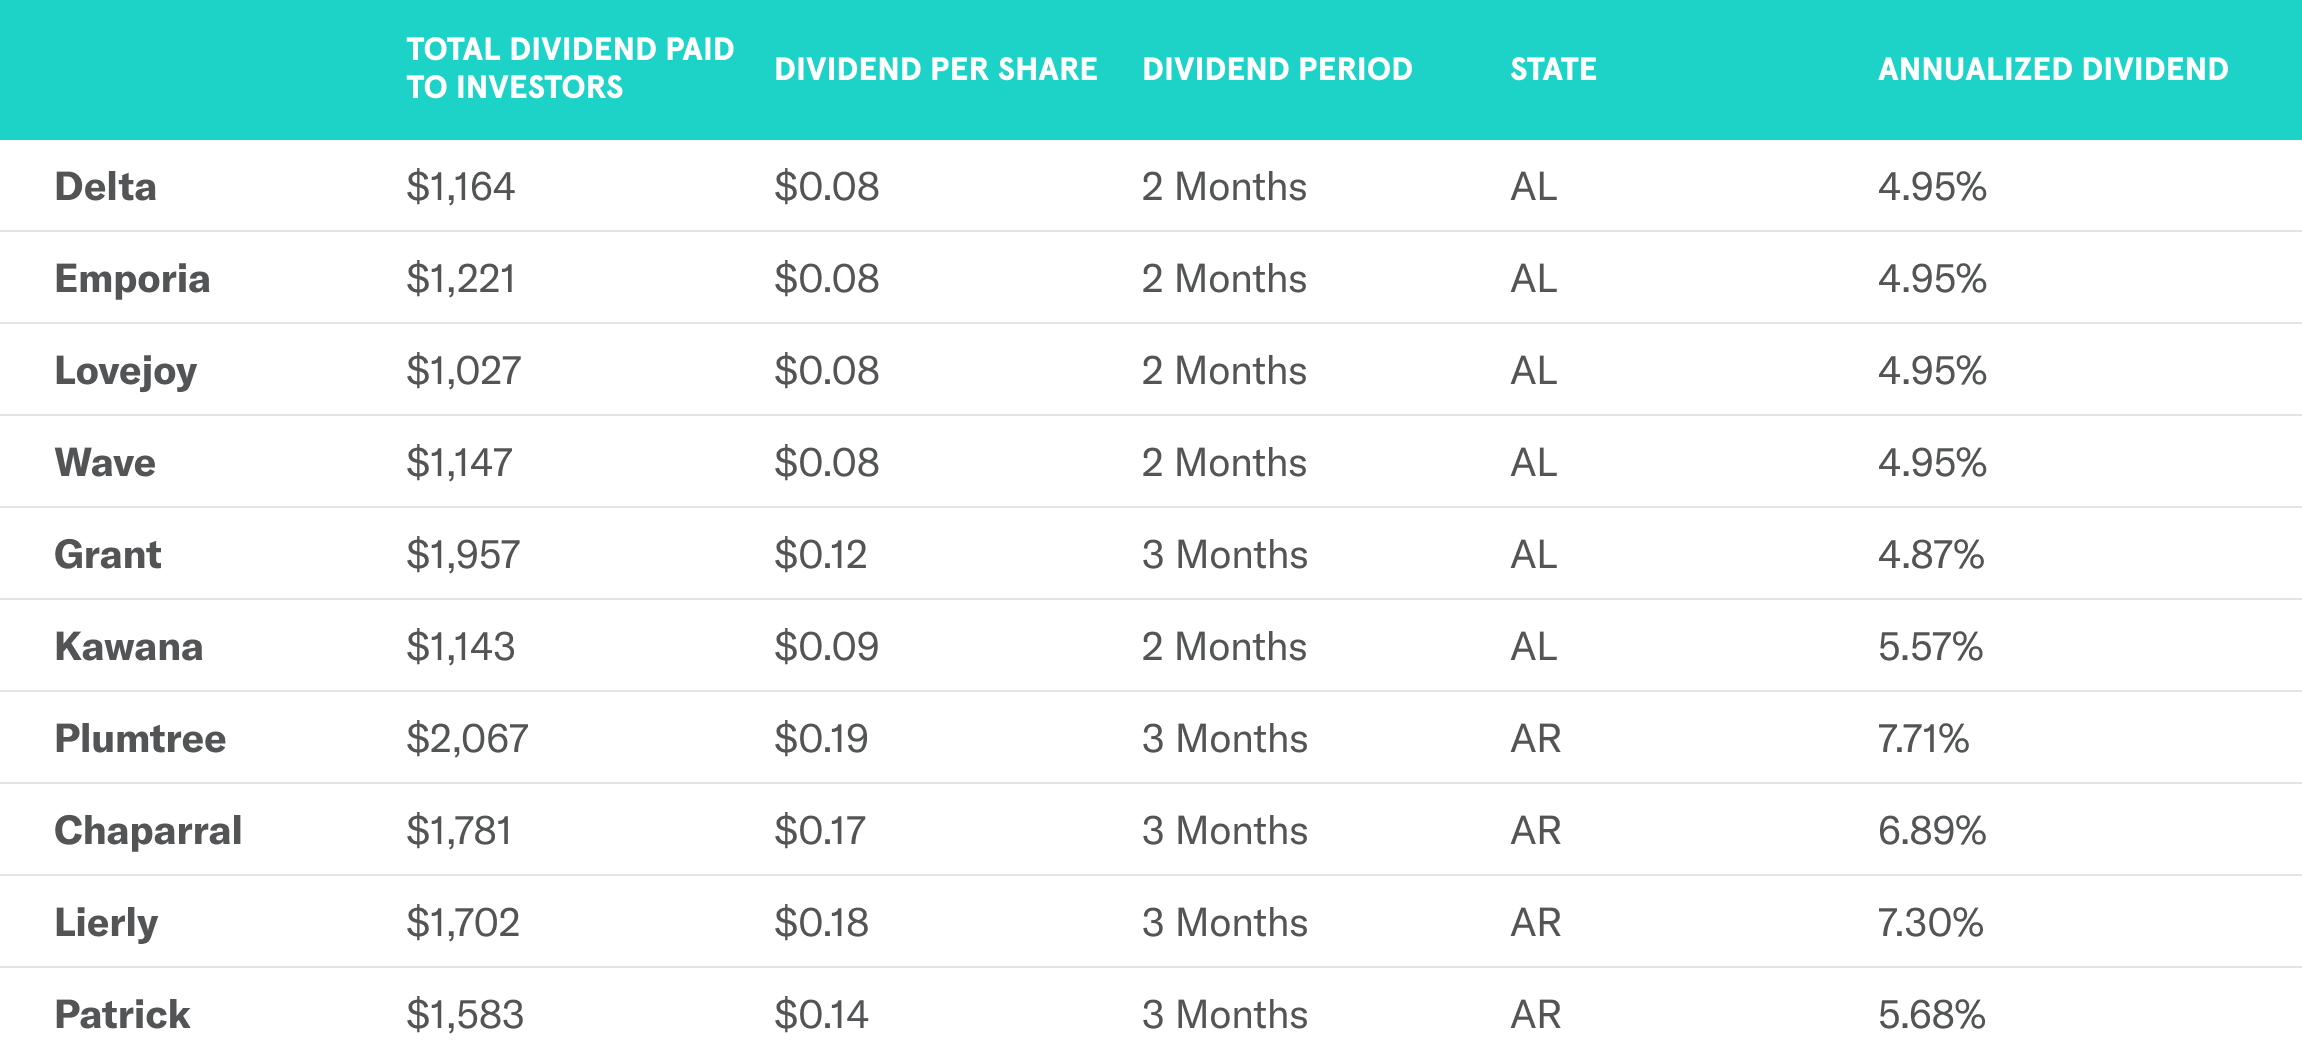
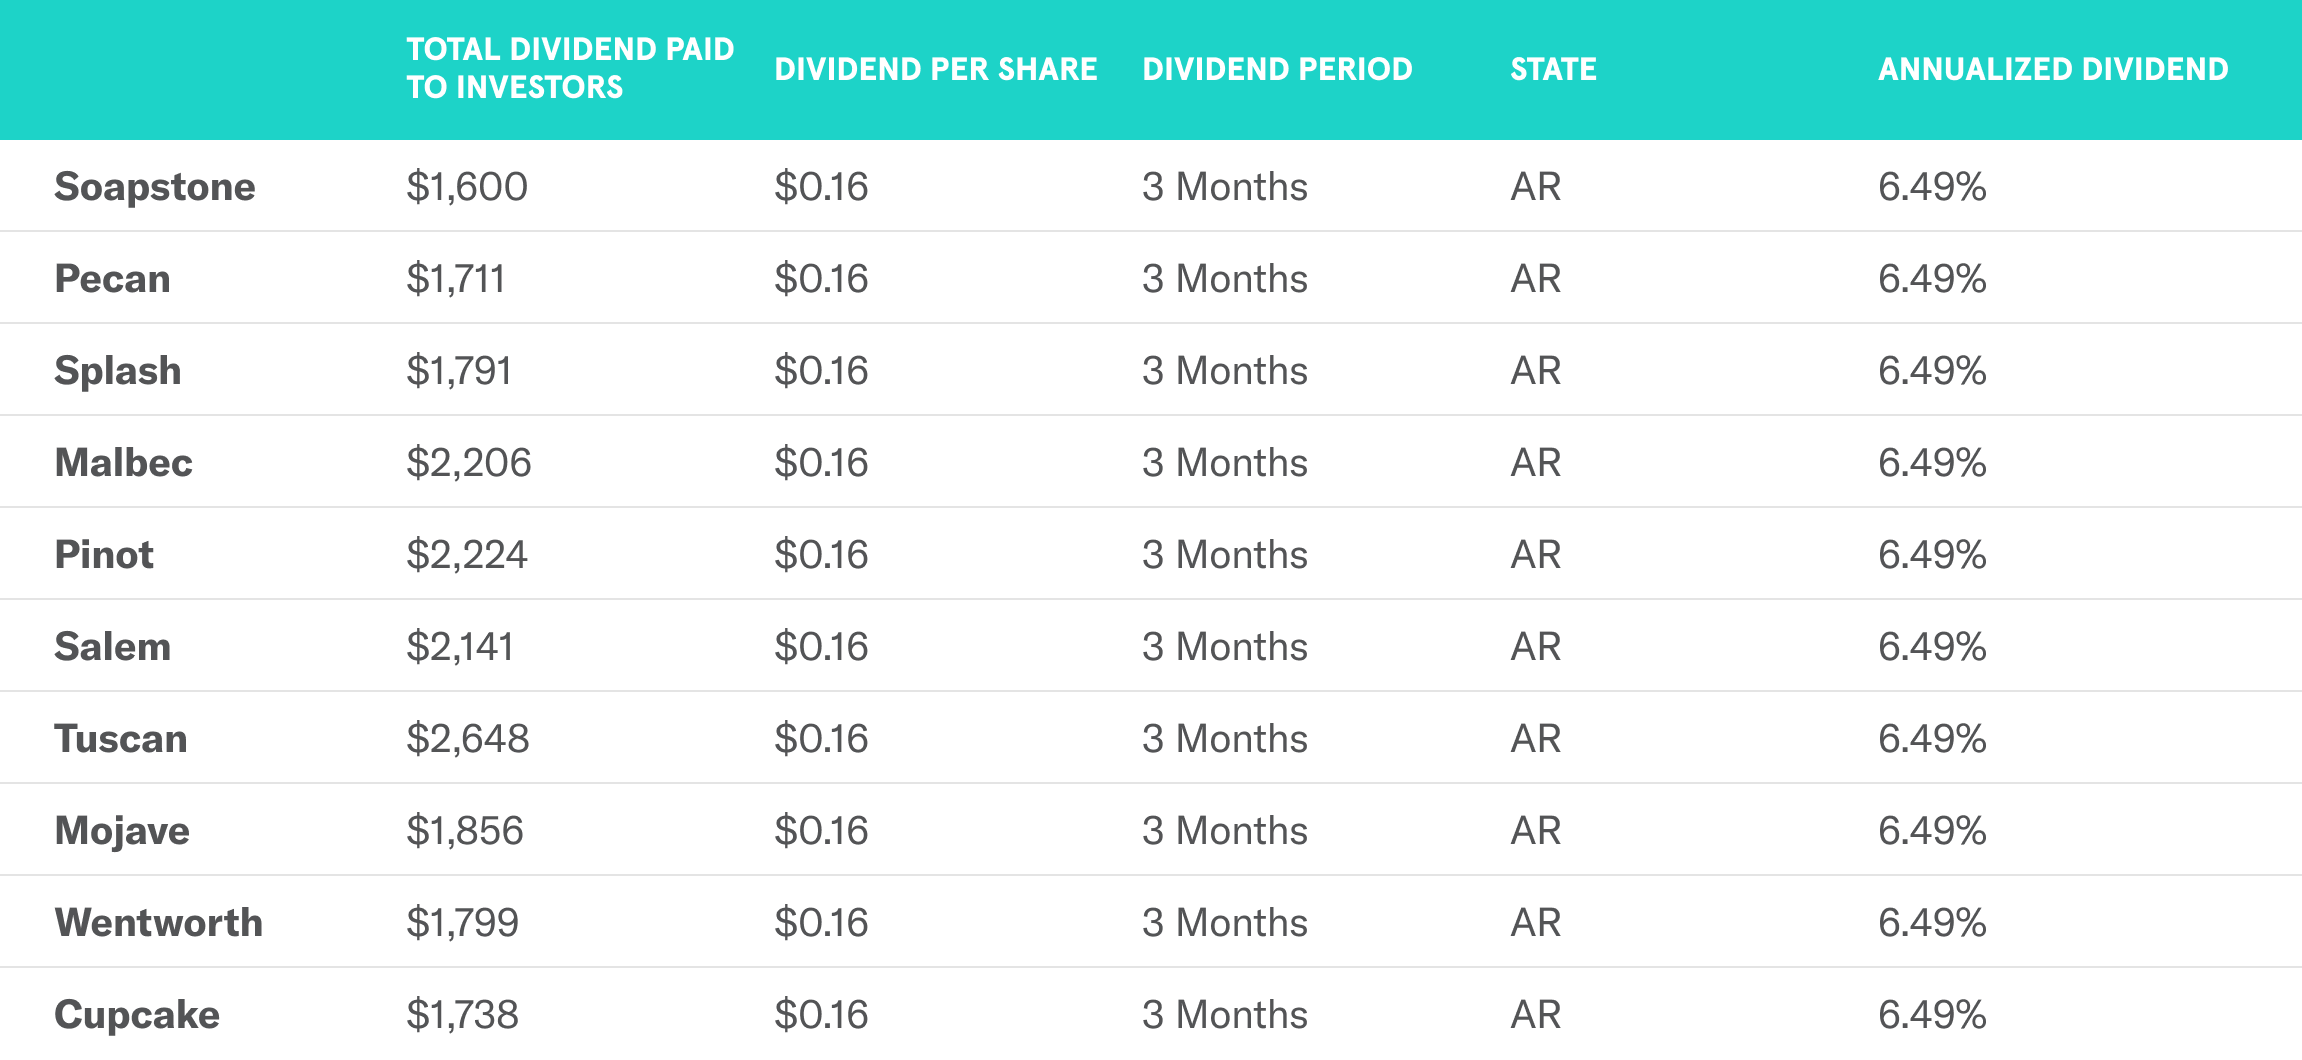
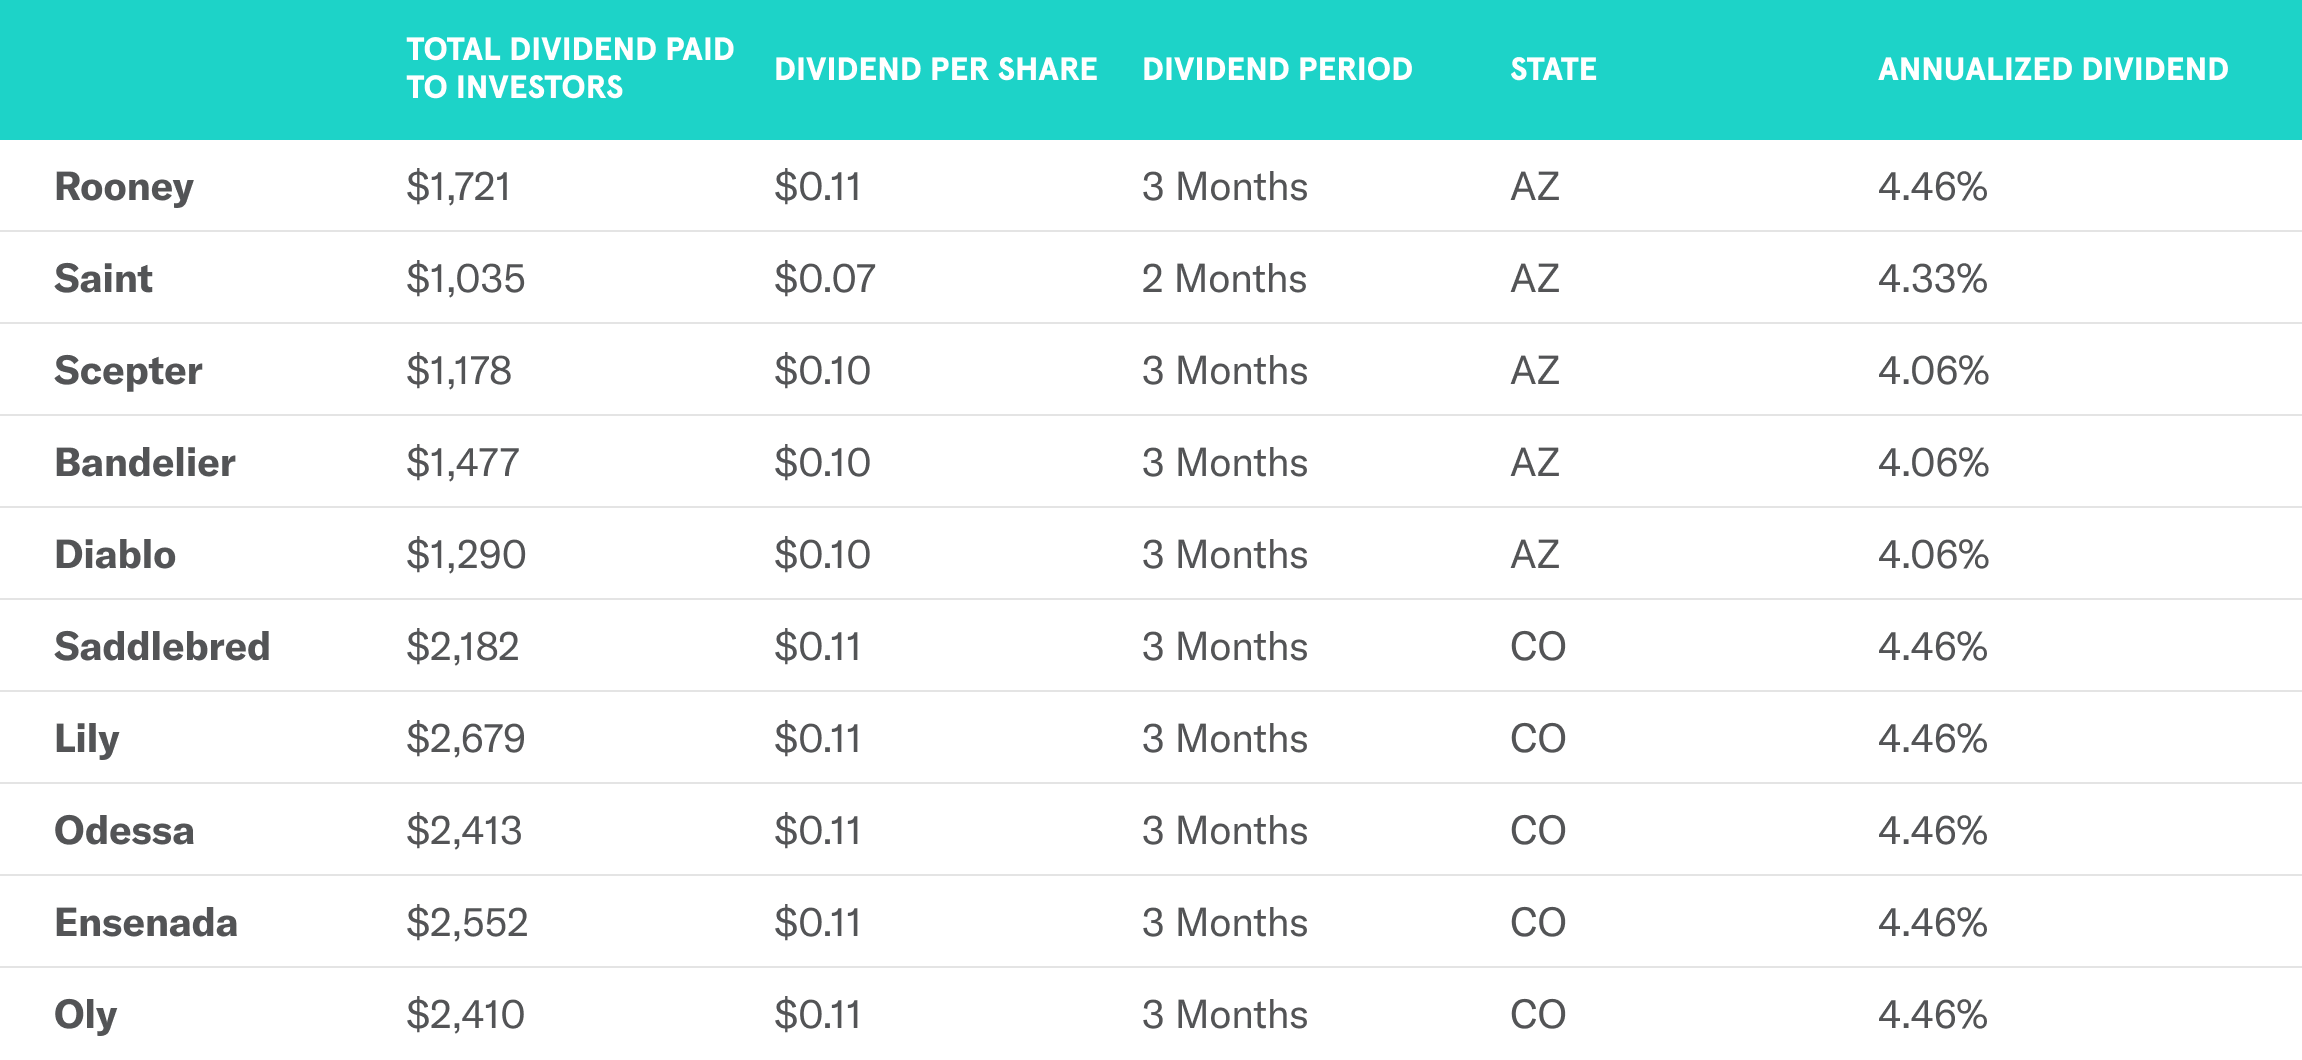
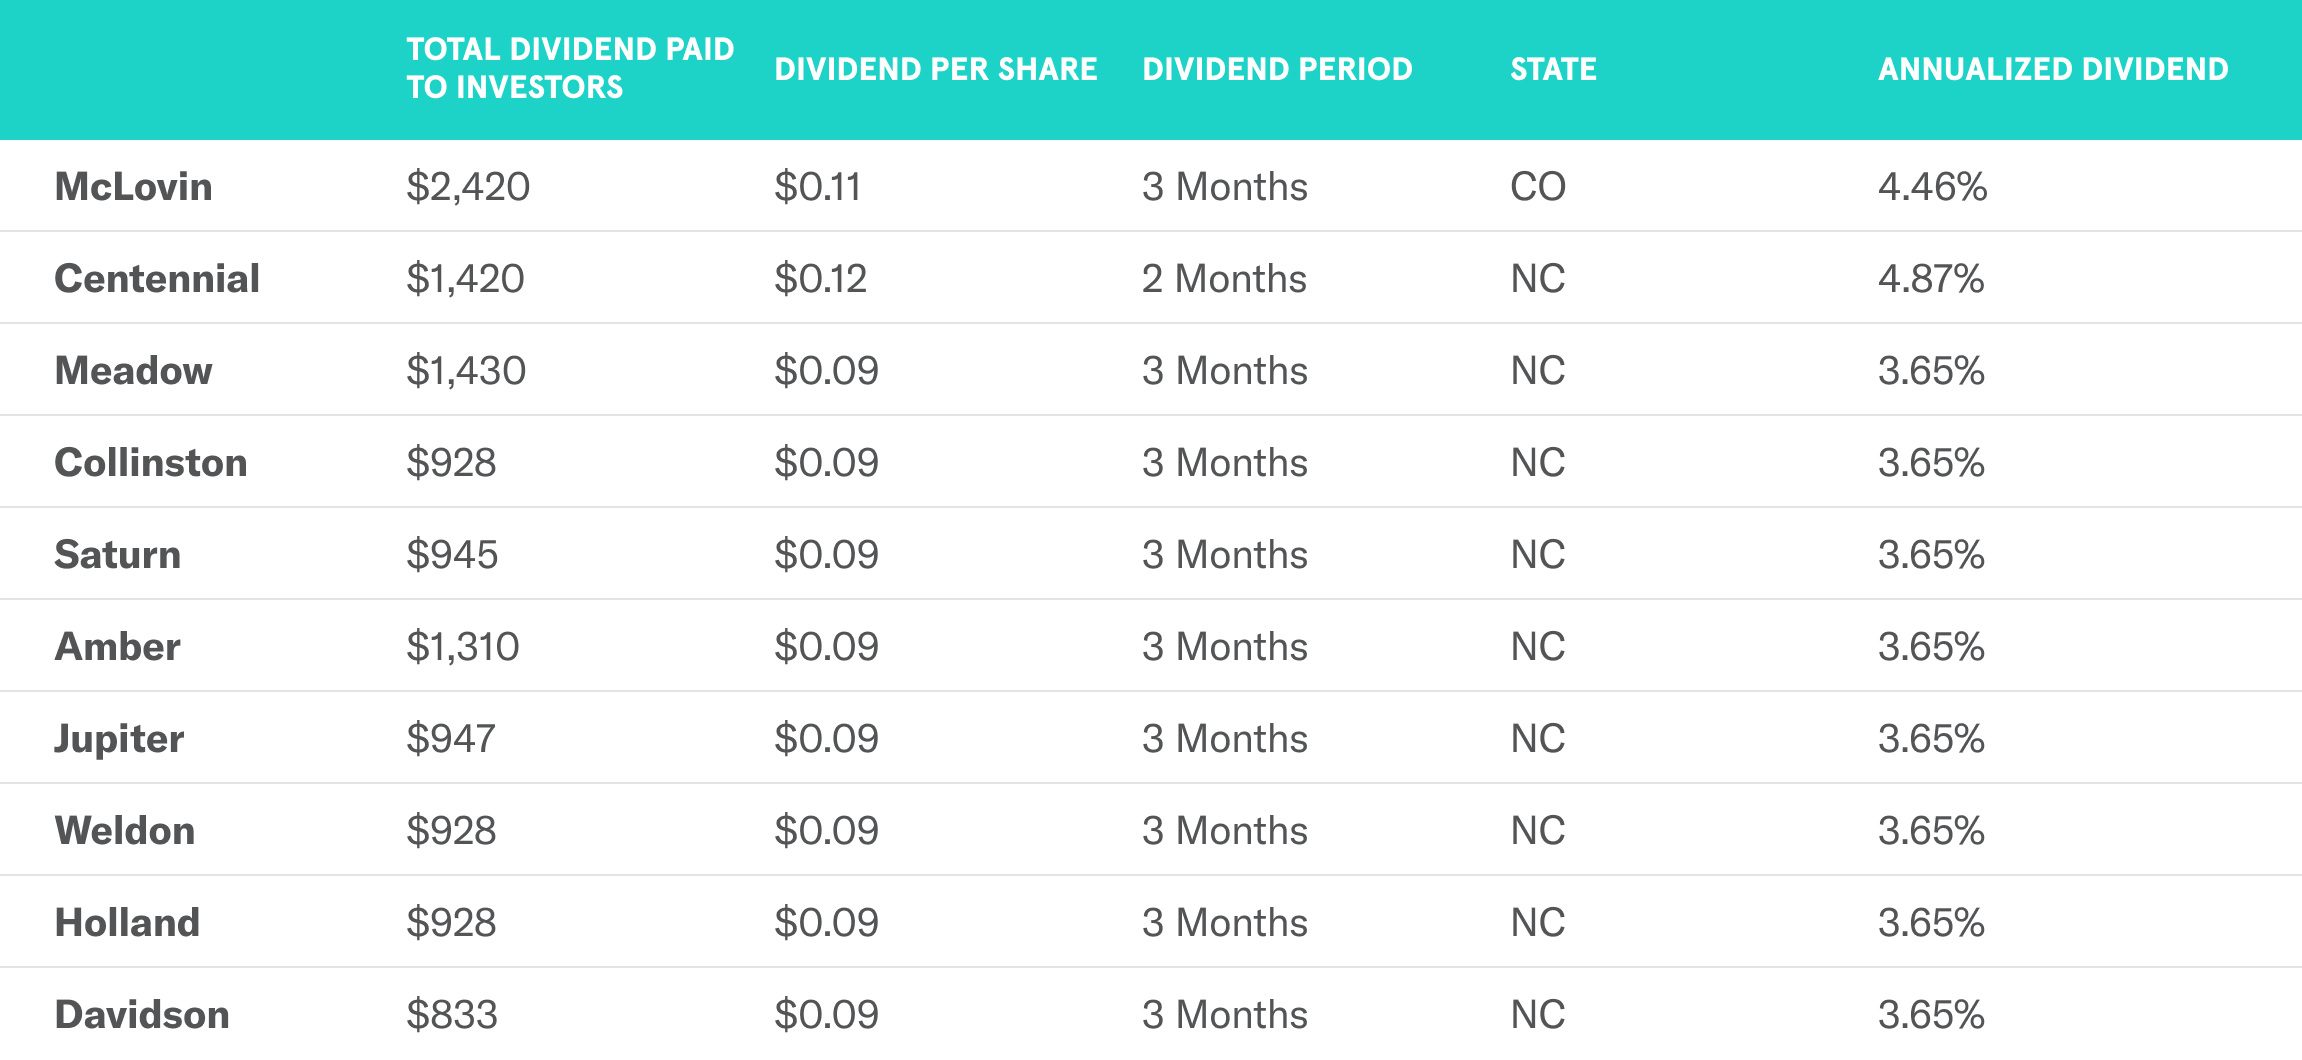
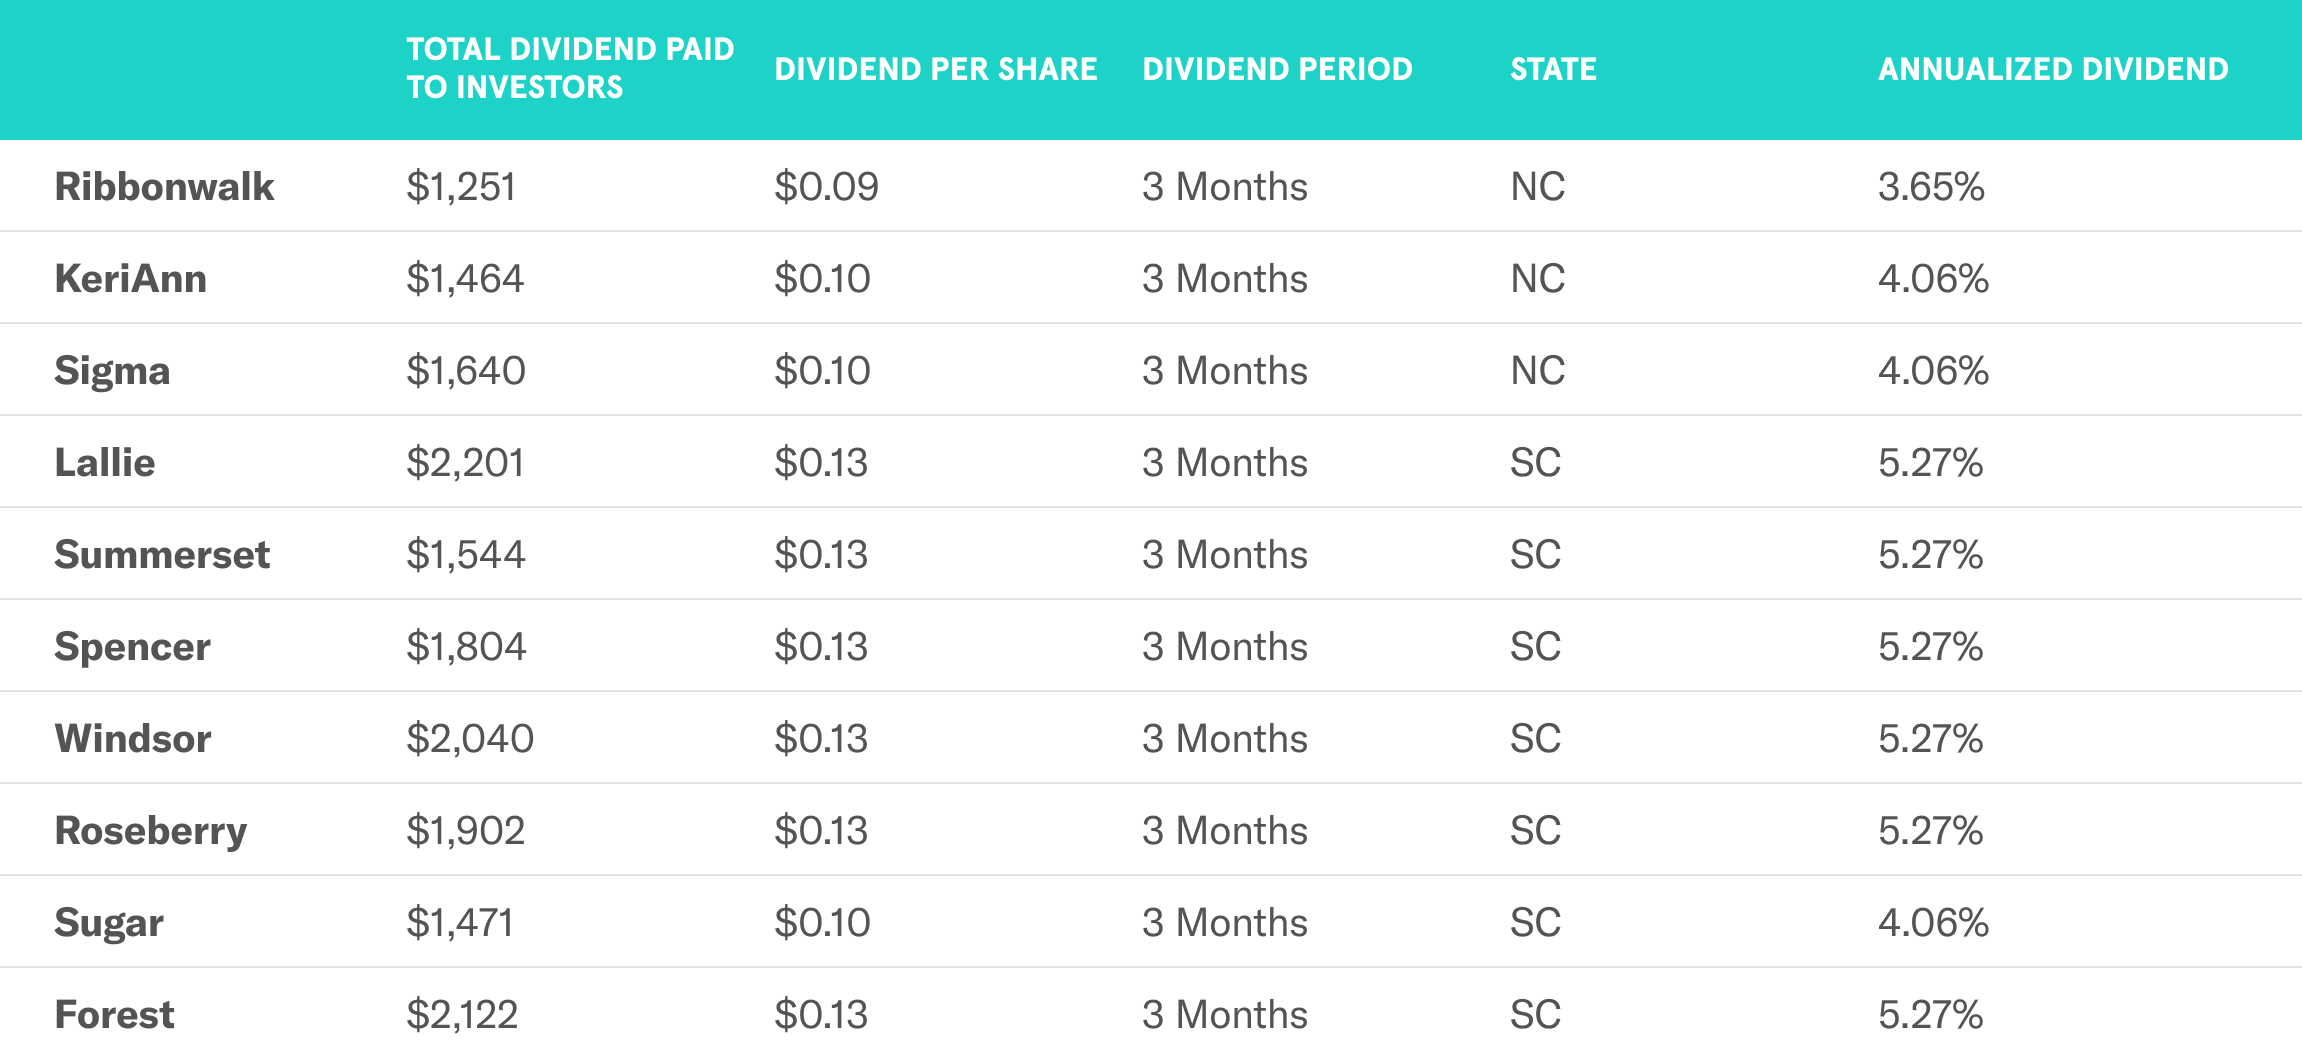
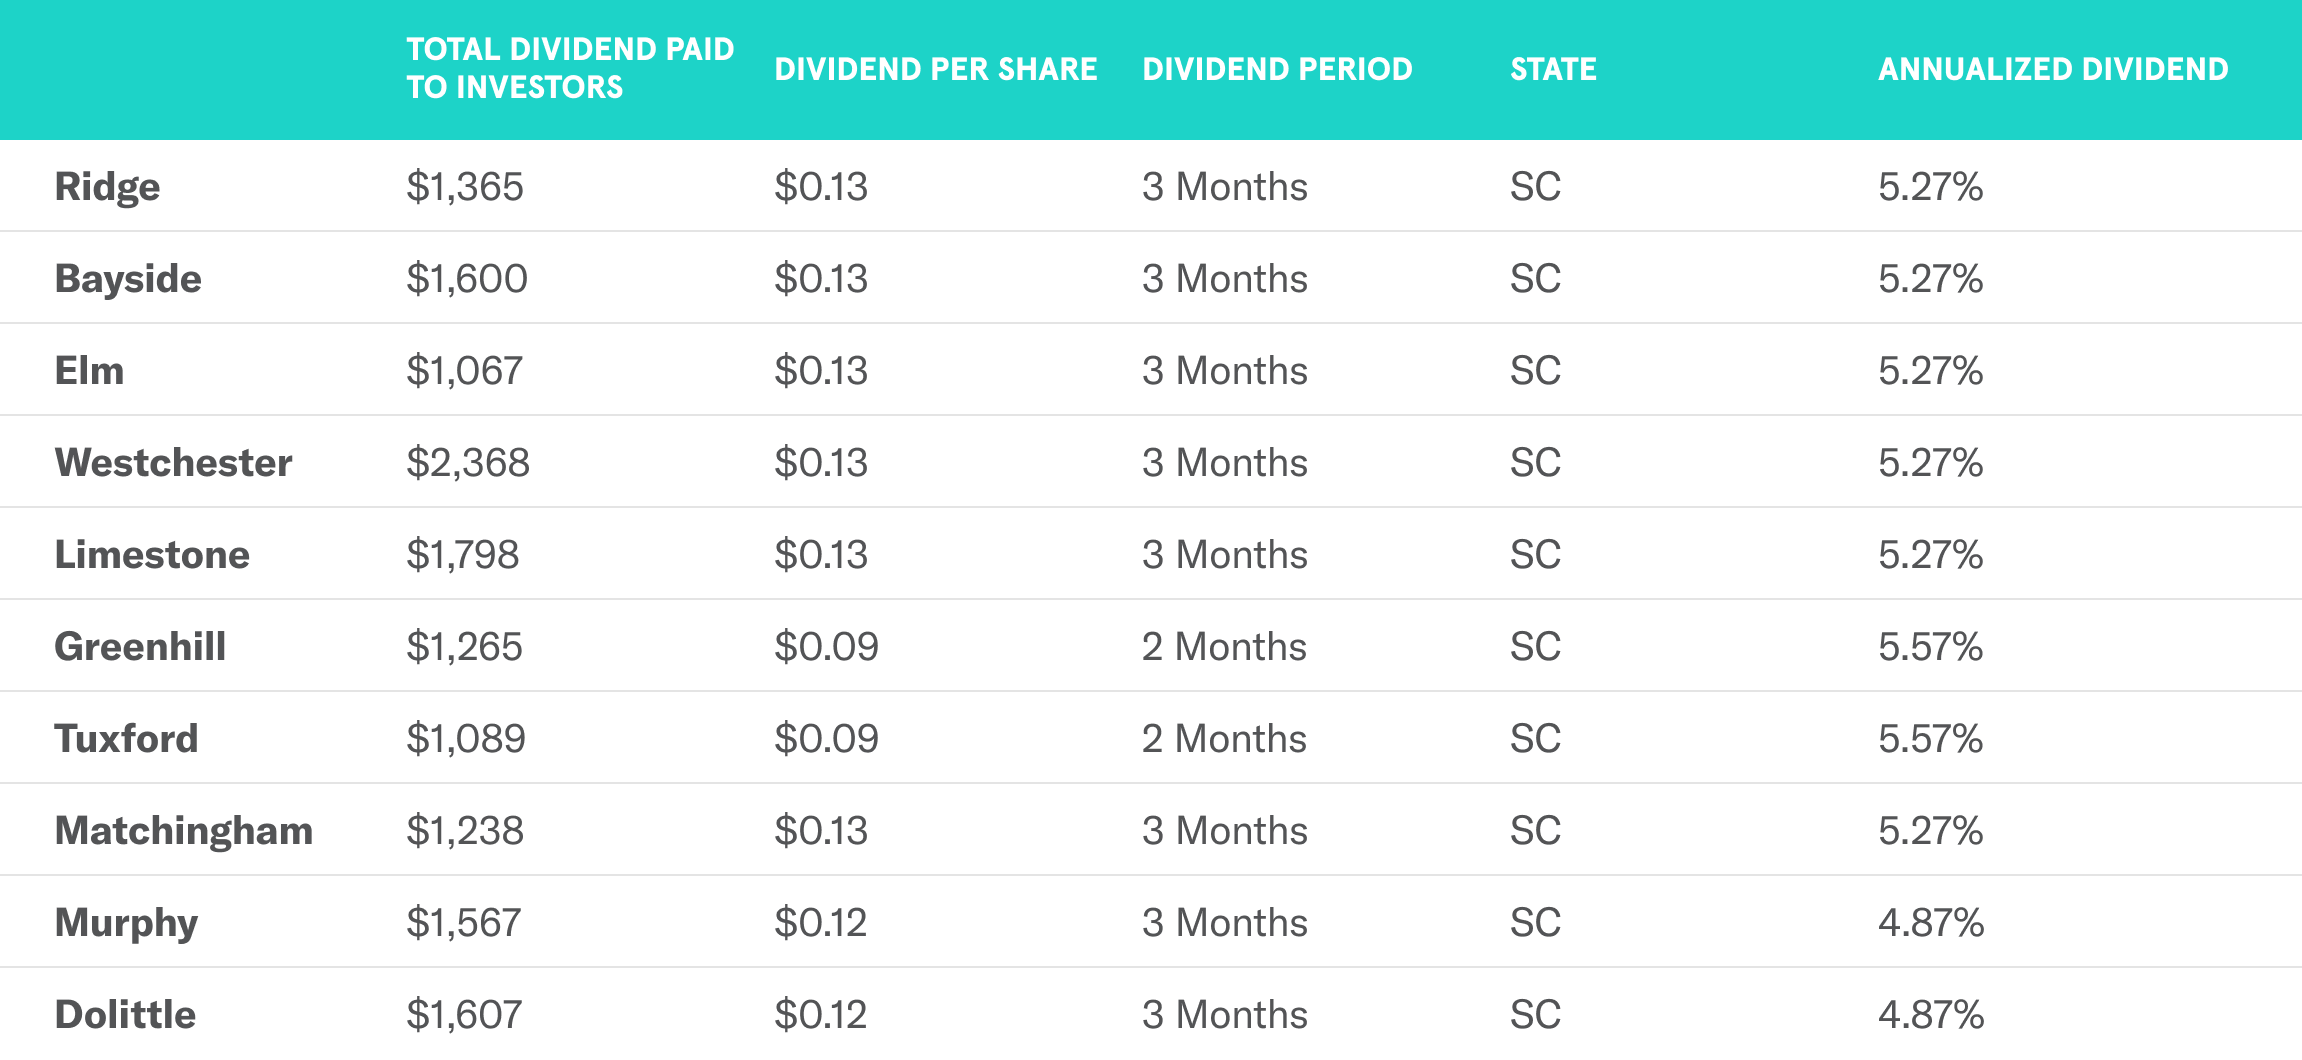
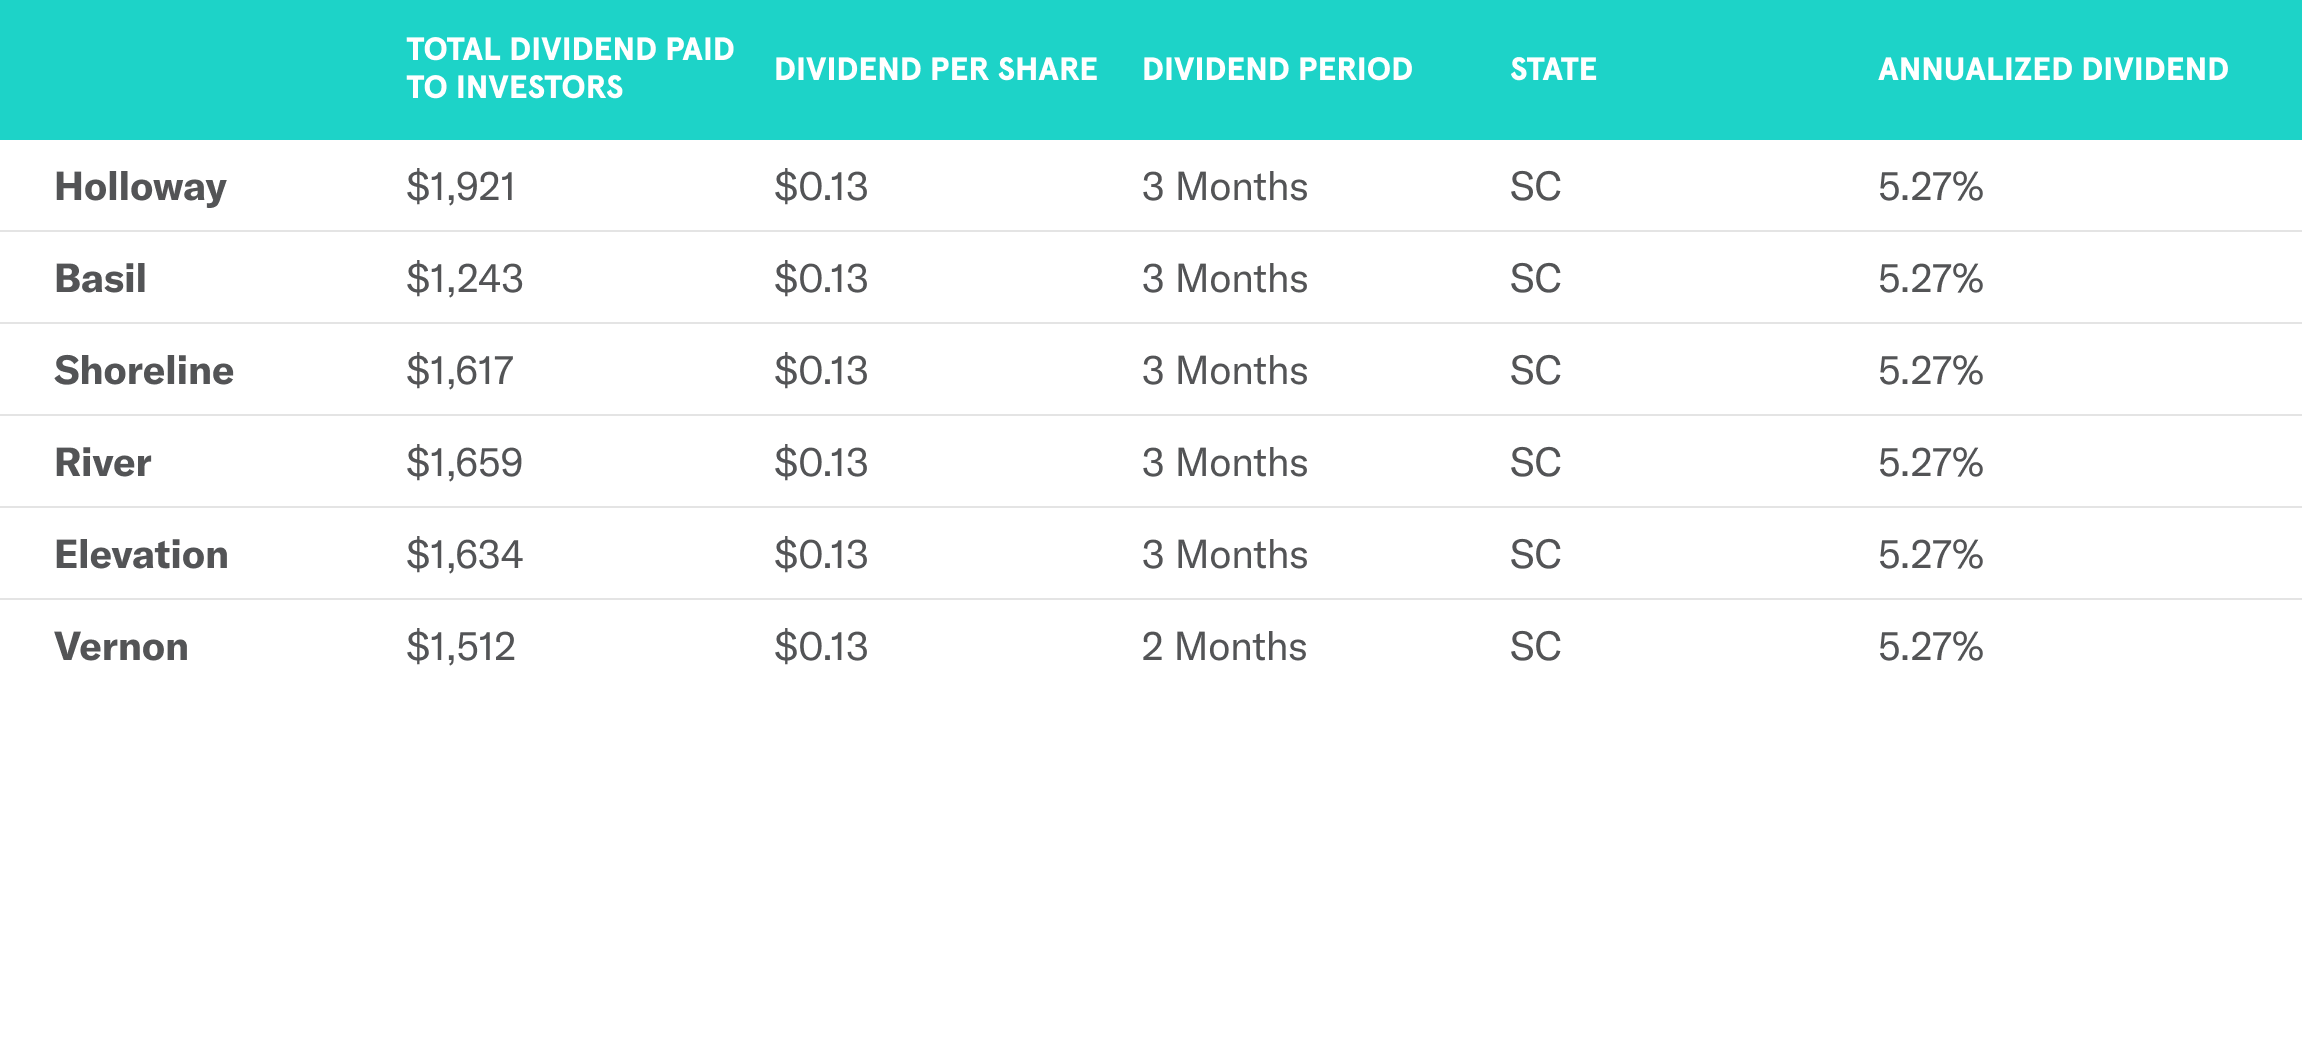
Here’s the Q1 dividends for each property. The properties that weren’t rented were able to pay dividends from the established cash reserve. As those properties lease up, future rental income will go toward replenishing the reserves and making dividend payments to investors. This results in consistent dividends for investors – a key piece of the Arrived operating philosophy.
The annualized dividend for each property is calculated by taking the Q1 dividend and extrapolating out for a full year.
Property Financials
To analyze the property performance, we’ve cohorted the properties into 2 groups.
Cohort 1 is made up of stabilized properties. These 28 properties have been owned by investors for 8-13 months, our longest investments, and their operations have reached the final lease-up stage and have ongoing operations.
Cohort 2 is comprised of newer properties that are still undergoing setup for their operations. There are 48 properties in this group. Of them, 40 properties were bought by investors in December/January and had roughly 3 months of lease-up period. There were also 8 properties investors bought in February that had only 2 months in the quarter of lease-up operations.
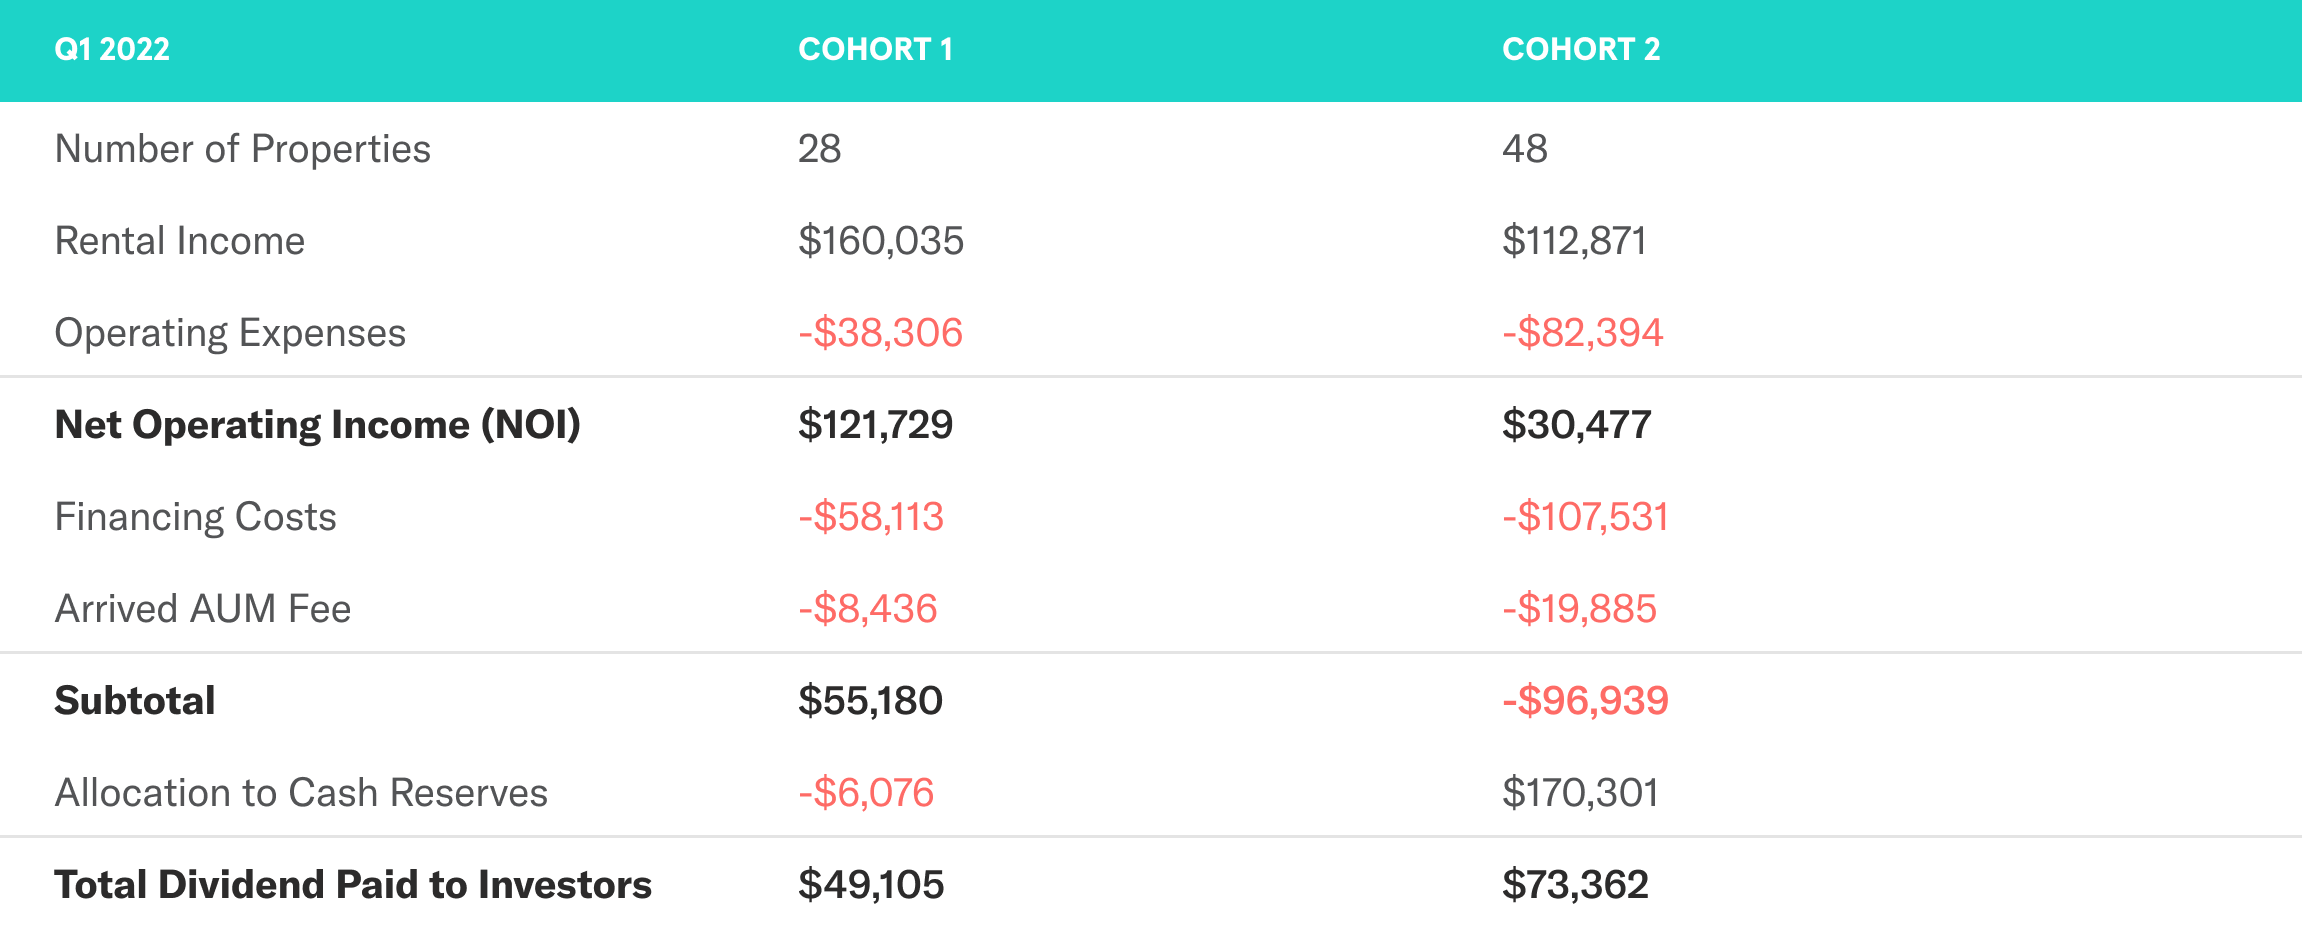
Here are the financials for each cohort. Cohort 1 clearly performed better, because the properties have been operating for longer and are all stabilized. As we continue to lease up Cohort 2, that group will become stabilized and the future financials will start to look similar to Cohort 1.
We’ll look at the overall cohort performance, as well as the monthly average per property. You can view the property financials for specific individual properties by scrolling to the very bottom of the property pages.
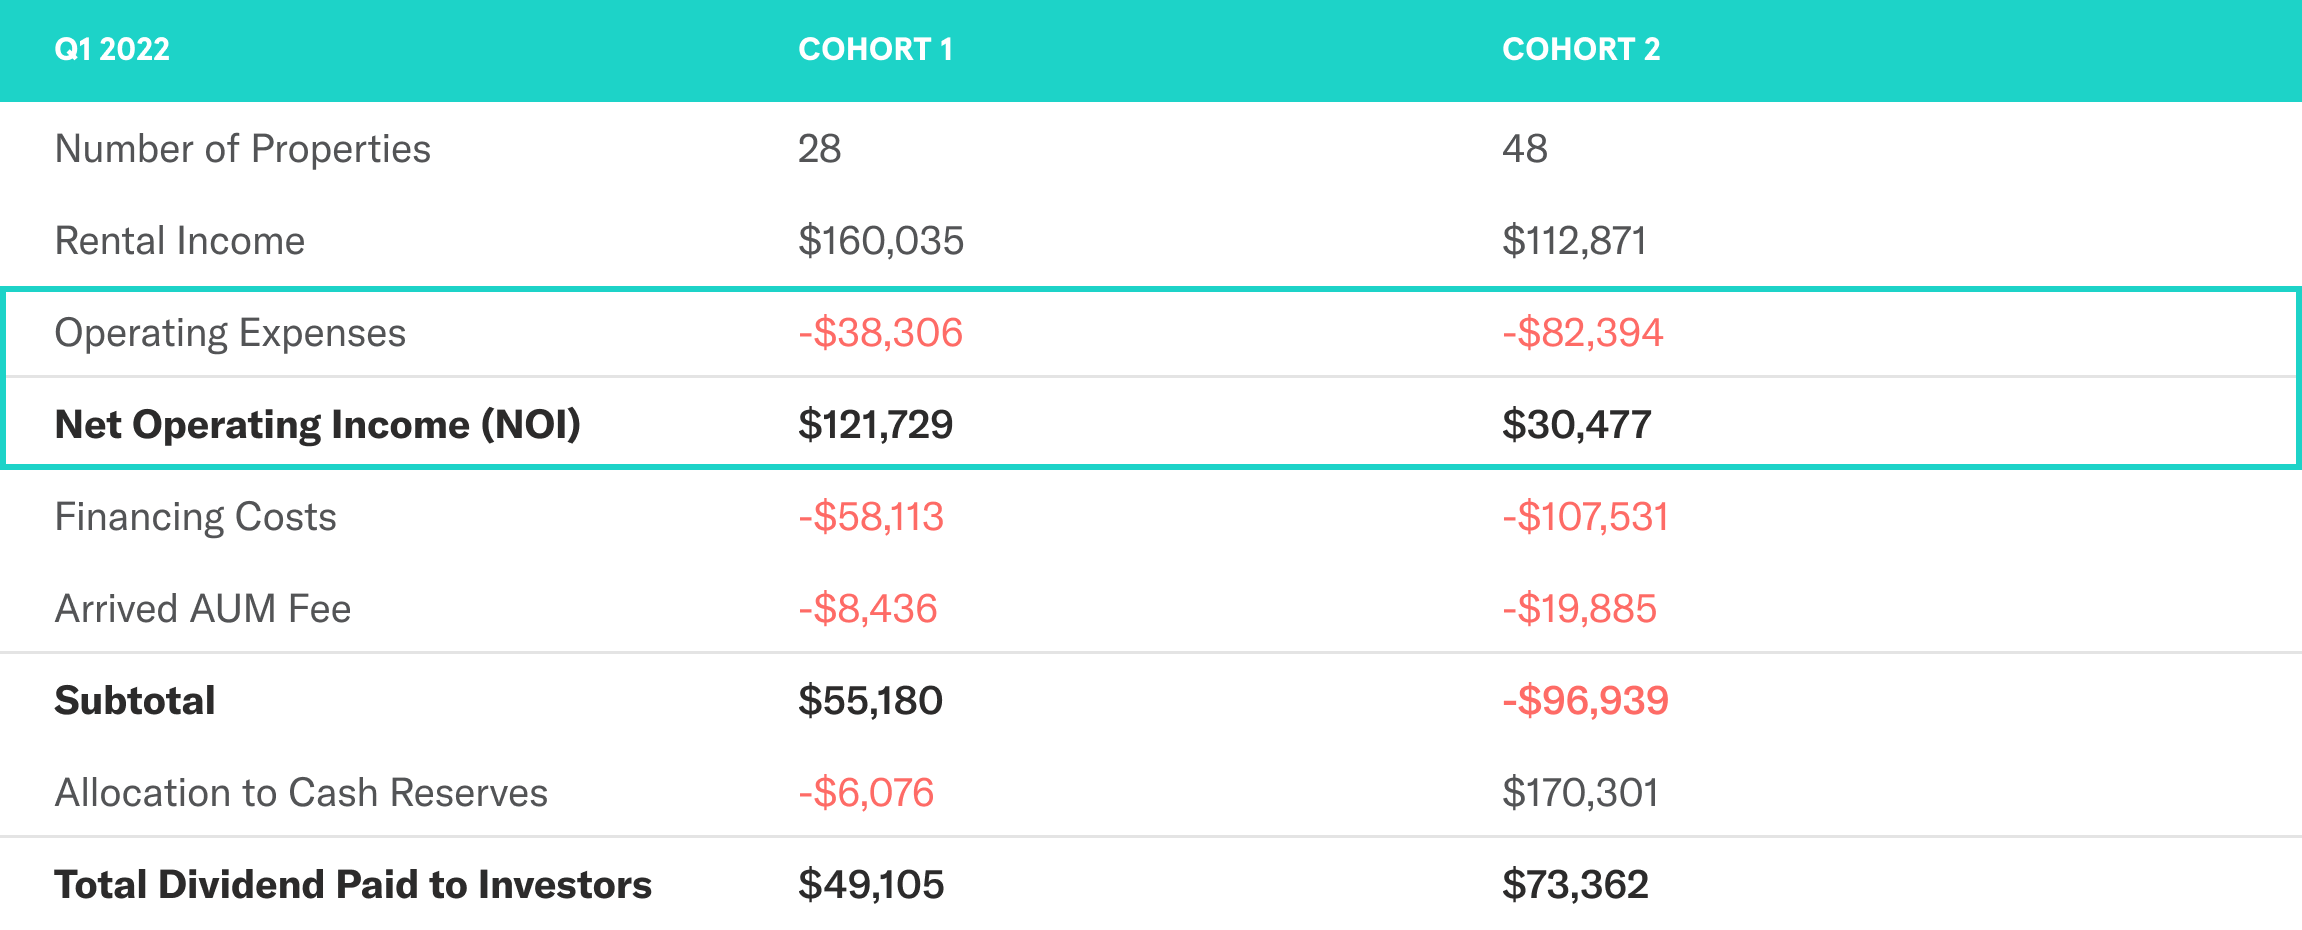
Totals for the Quarter
Average per Property per Month
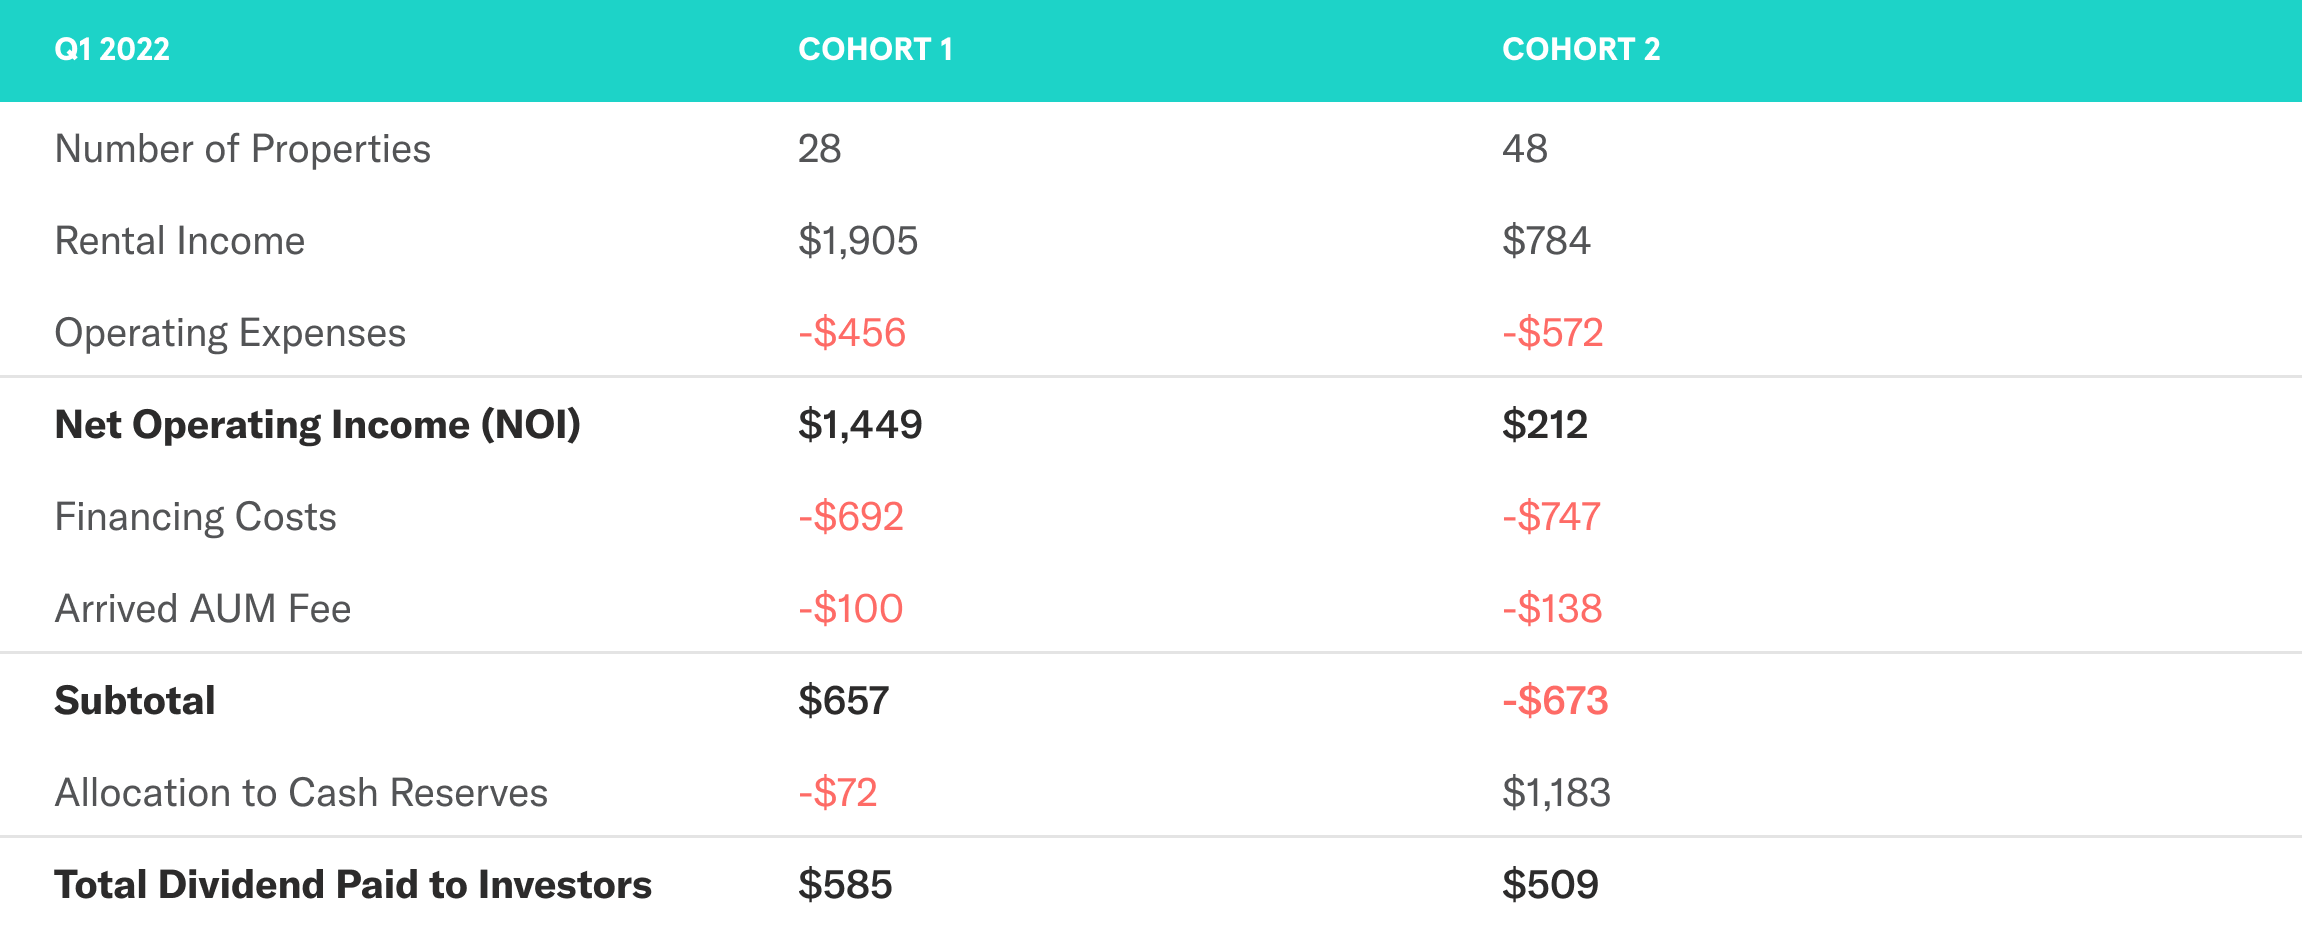
Rental Income
This line represents all the income collected from tenants. It’s mostly the monthly rent, though there’s also pet rent and any fees included in this top-line income as well.
Cohort 1 was 95% occupied at the end of Q1 (27/28), and the average monthly rental income collected was $1,905. As mentioned above, Cohort 2 was 50% occupied at the end of the quarter (24/48), and so the average monthly rental income collected was $784.
The collected rent was obviously much lower for Cohort 2 since properties were recently acquired, and oftentimes still having value-add improvements done before even marketing them for lease. Over time the properties will lease-up, and the average rent collected will get closer to our stabilized Cohort 1.

Operating Expenses and Net Operating Income
Properties in Cohort 1 had average monthly operating expenses of $456, while properties in Cohort 2 had average monthly operating expenses of $572. The extra operating expenses for Cohort 2 are generally utilities that are paid out of the cash reserve while there’s no tenant, as well as repairs, maintenance, and improvements that are being done while the property isn’t occupied.
Properties in Cohort 1 had an average expense ratio of 24%. That means that for every $1 in rent collected, 24 cents went toward operating costs. The industry average for single-family home rentals is typically 28-35%, so we are very proud of this performance.
Generally, the operating expenses are lower when the property is occupied and higher when vacant, so over time, we’re on track to be at or better than the industry average. Properties in Cohort 2 were significantly higher at an average of 63%, which will conversely come down as the properties lease-up and generate rent and as expenses slow during the occupied period.
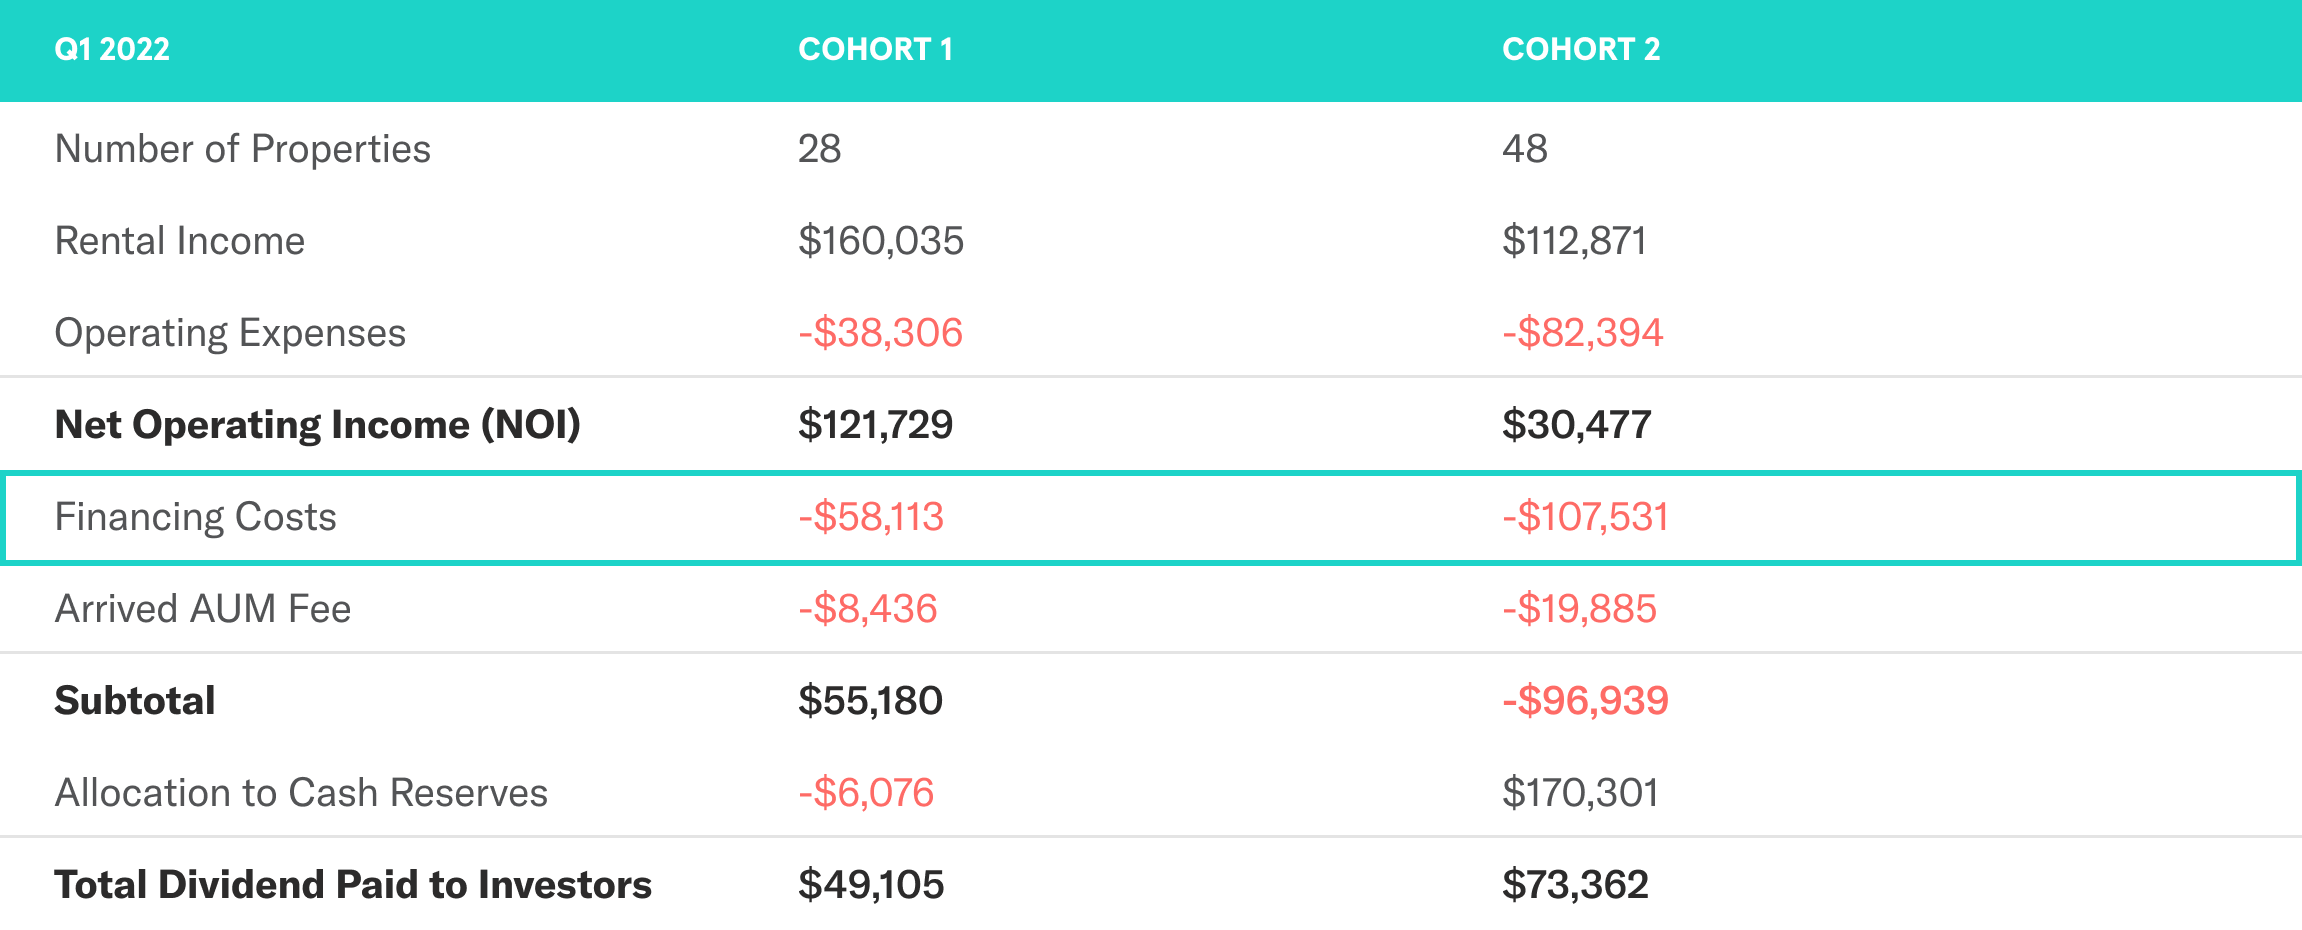
Financing Costs
This line item includes the interest expense for the loan, as well as the annual audit costs for each property. Our 2021 audited financial statements are available on the SEC’s website here.
This line item doesn’t really change since the loans on the property are fixed-rate, interest-only payments. Cohort 2 is slightly higher just because the properties in that cohort are more expensive (and therefore had larger loans).
Arrived AUM Fee
Like the Financing Costs, this line item is going to be consistent from quarter to quarter. As a reminder, Arrived charges a 1% of Assets Under Management fee for continuing to operate and manage the rental homes.
The good news is that this is 1% of the initial equity invested by investors. Even though investors’ equity in the property may rise with the Share Prices, the 1% is set on the initial investment amount and won’t increase. Similar to Financing Costs, this was slightly higher per property for Cohort 2 because the properties were more expensive, and therefore there was more investor capital required to complete the investment.

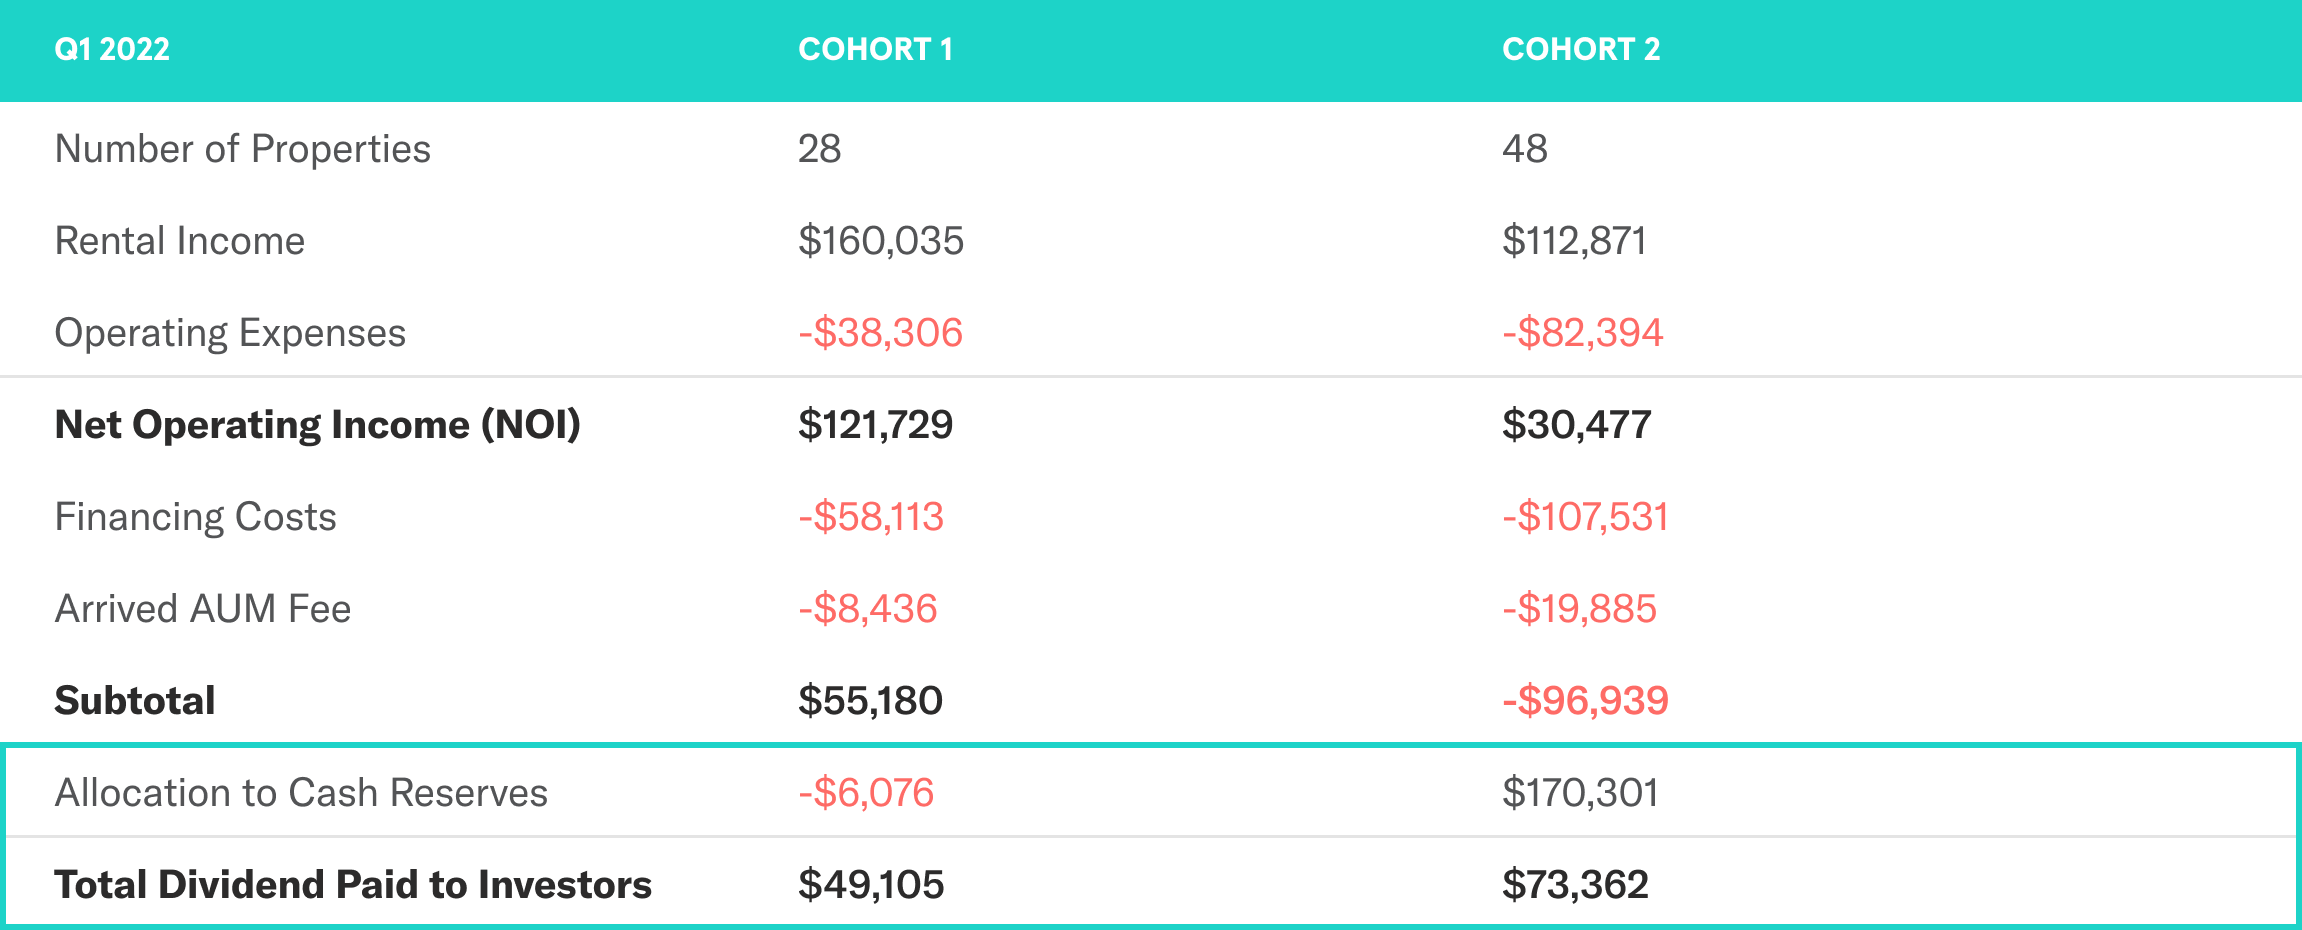
Allocations to Cash Reserves and Dividends
These two line items on the financials go hand in hand. As the properties generate income, there are two main options for what to do with the money: 1. Distribute it to Investors, or 2. Save it in the cash reserves.
As the properties generate income, we typically distribute most of it to investors and save some in the cash reserve.
Maintaining healthy cash reserves allows us to commit to not asking investors to invest more in that property. Down the road we can either use those funds for property improvements, or we can distribute it out to investors.
Cohort 1 illustrates this beautifully. The 28 properties paid out an aggregate $49,105 out to the investors, and saved $6,076 into the cash reserves. That’s roughly 11% of funds going to the cash reserve, with 89% being distributed to investors.
Cohort 2 shows the other value of the cash reserve. Even though the properties aren’t yet stabilized, we were still able to distribute $73,362 out to investors. Since they aren’t generating a ton of cash yet, we had to pull $170,301 collectively out of the cash reserves. As these properties lease-up and start to look more like Cohort 1, we’ll replenish and grow the cash reserves.
Share Prices
Arrived rental properties earn investors financial returns from income and appreciation. The financials show the operating performance of the properties and how they generate dividend income. But what about appreciation?
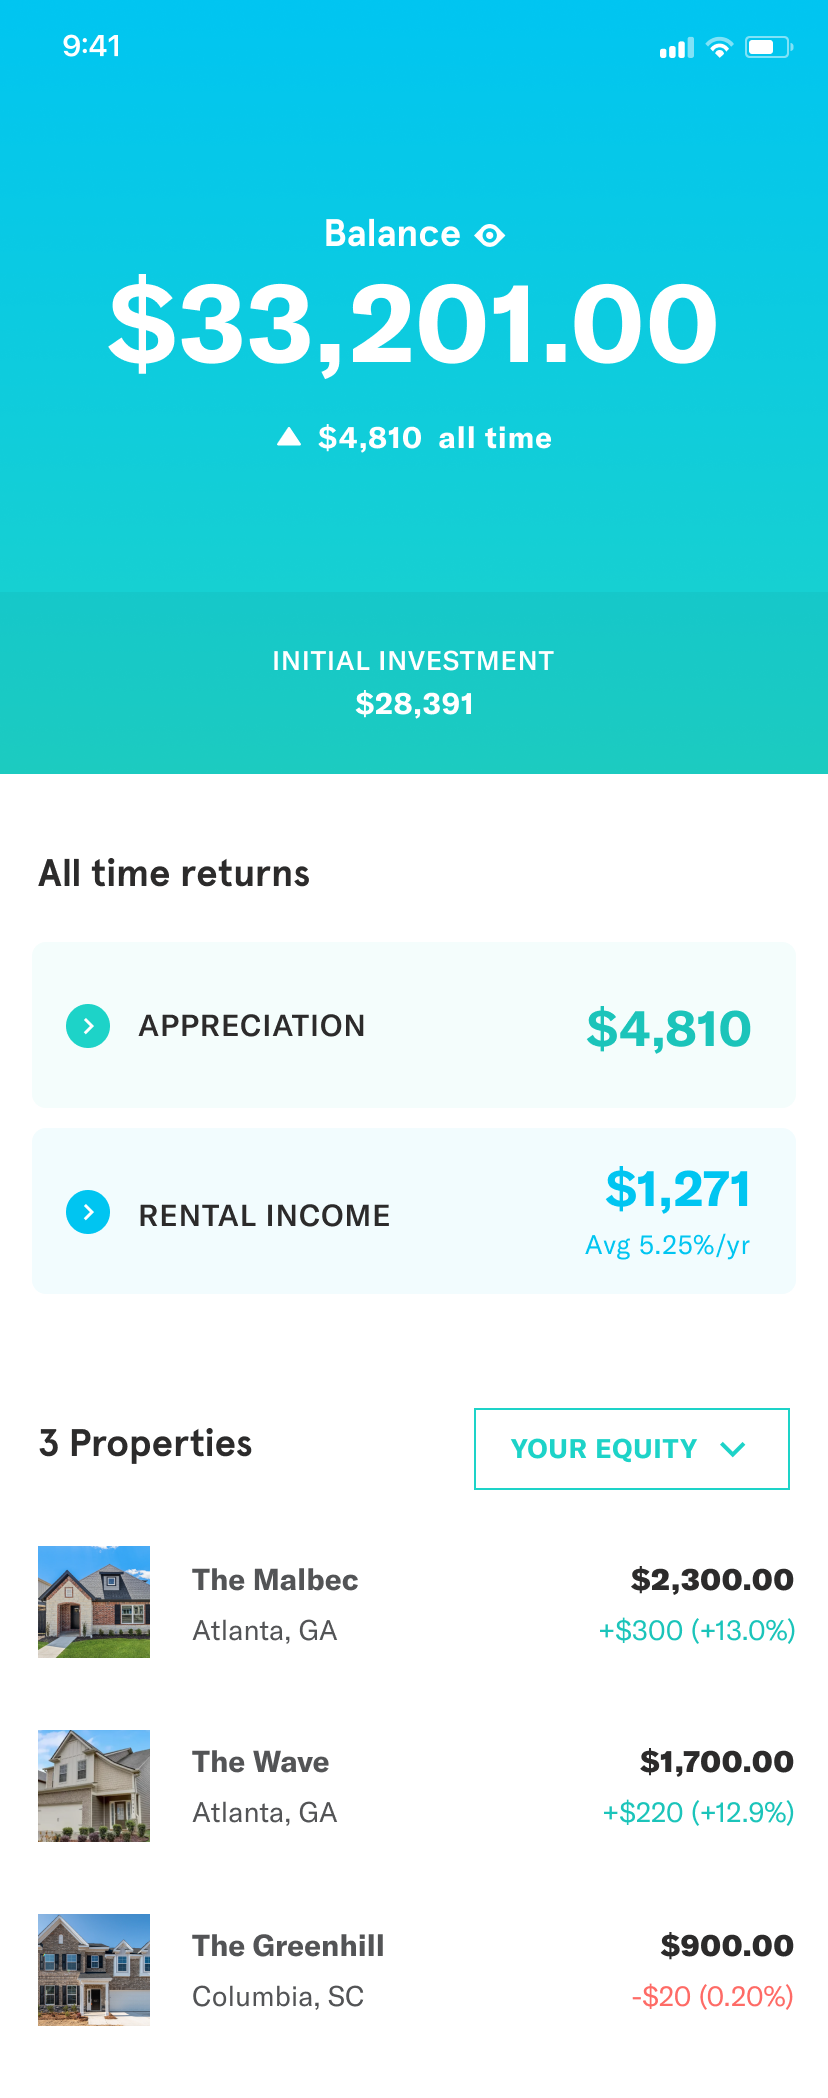
Arrived just rolled out Share Prices, a new way to see the value of your investment change. Each Arrived property starts out at $10/share, and on your Portfolio Page, you’ll be able to track the change in share values.
This is a big deal. Now, not only you can invest in a fraction of a home, at $10/share and start earning rent, you can now even see your “share price” go up/down with the value of the home. Next step will be a marketplace for these shares (stock market for real-estate). https://t.co/Q85TnCUH2q
— Hadi Partovi (@hadip) April 28, 2022With Share Prices, you’ll now be able to see how both components of rental home investing work together to earn you immediate cash dividends and long-term capital appreciation. If you want to see it all in one place, check out our new historical returns page.