
Arrived 2021 study on the annual returns obtained by investing in rental properties over the past 20 years
Investing in residential real estate has proven to be one of the best ways to build wealth in America for the past 100 years. This is driven by the remarkably consistent growth in property values over time and the strong renter economy (36% of US Households as of 2019¹), providing dependable rental income to its owners.
Despite housing being the single largest asset class in the world, there is surprisingly little information available publicly on the type of returns and profits investors can expect from investing in this asset class.
At Arrived, we have spent the past few months putting together an in-depth study that looks through historical data so that we can piece together what we believe is the most complete picture of historical returns for single-family rental properties.
Our findings show that investing in leveraged single-family rental homes over the past 20 years would have resulted in an 11.7% annual return on investment. Below is a full deep dive into these results along with our methodology and data sources.
While past performance is not indicative of future results, we believe historical data is an important part of understanding what type of returns can be obtained from the asset class.
Two Ways To Make Money On Rental Homes
Before getting into the data, it’s important to understand that there are two primary ways that investors profit from investing in rental properties. Property Value Growth and Rental Income.
Property Value Growth: As property values appreciate over time, investors grow their equity value in that property. These returns are magnified by purchasing a property with the help of low-cost debt (aka a mortgage loan).

Rental Income: Tenants pay rent on a monthly basis, and after the expenses, the cash flow goes to the investors.
Summary of Findings
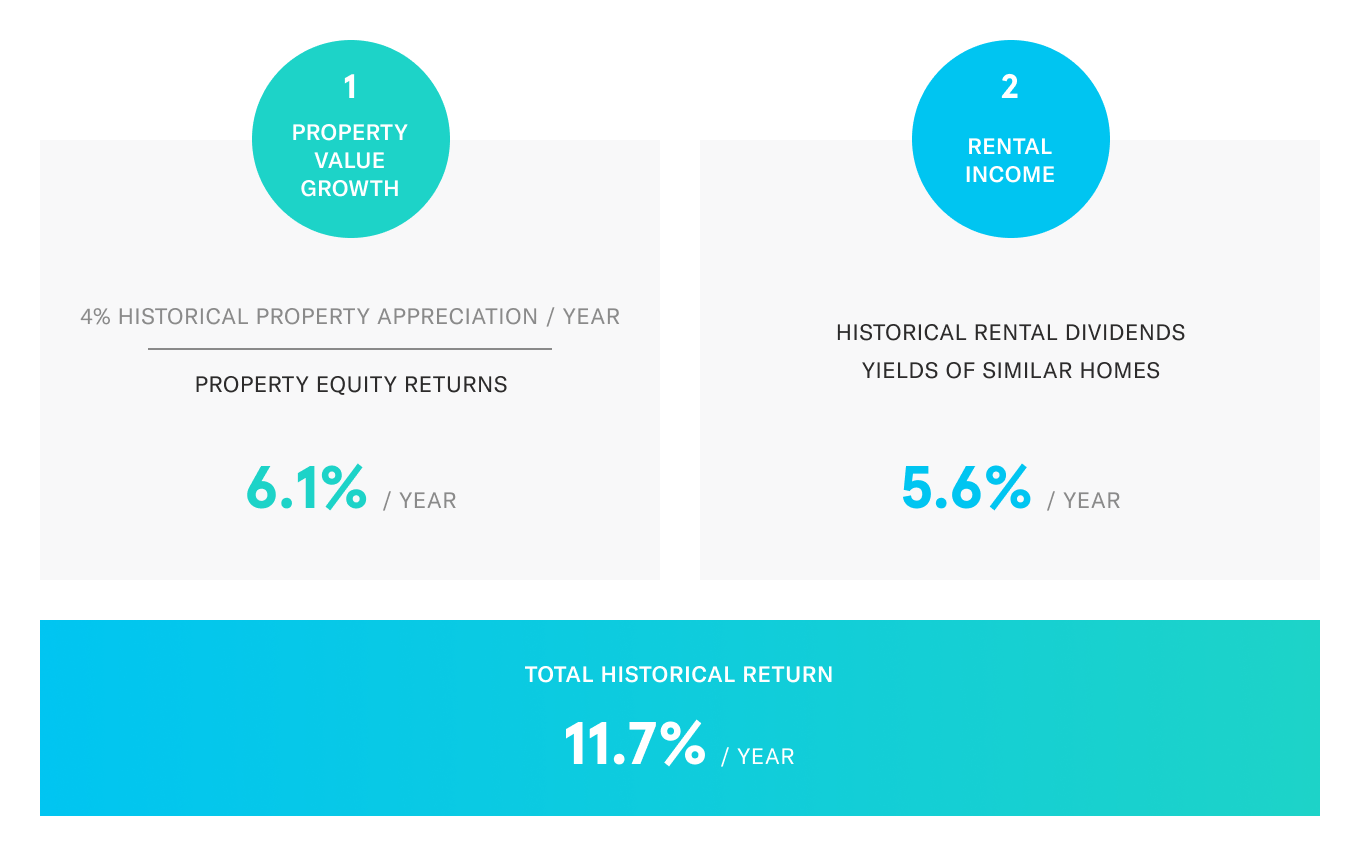
Below is a high-level summary of our study’s findings that breaks down returns between both property value growth and rental income. The property value growth data includes property value appreciation from the last 20 years and the rental income includes the annualized dividend yields that Arrived rental homes have paid out historically. Scroll down to view each section’s breakdown and the methodology used in the 2021 study.
1) Property Value Growth
In order to best understand the historic investment returns from property value growth, it is important to break down the three main components.
Property value changes + Use of Mortgage = Changes to equity value
This simple formula shows the two different levers that impact your investment returns in single-family homes. If property values increase and you partially pay for your purchase with a mortgage (also known as debt or leverage), then your investment equity value will grow more quickly. Alternatively, if property values go down and you use a high amount of debt to purchase your property you will lose money more quickly.
Given the importance of those three different components, we will analyze data for each of these categories below.
Historical Property Value Appreciation
A big part of your investment returns will be determined by the property value changes over time. So let’s look at the past historic property value appreciation for the United States. Below we can see the property values across the USA over the last 10 years. This data is taken from Zillow Home Value Index (ZHVI) (data linked here & detailed methodology linked here), is specific to Single Family Homes, and measures the typical home value for properties in the 35th to 65th percentile range. This data shows that the compound annual growth rate (CAGR) of property value in the USA has been 6.49% per year.
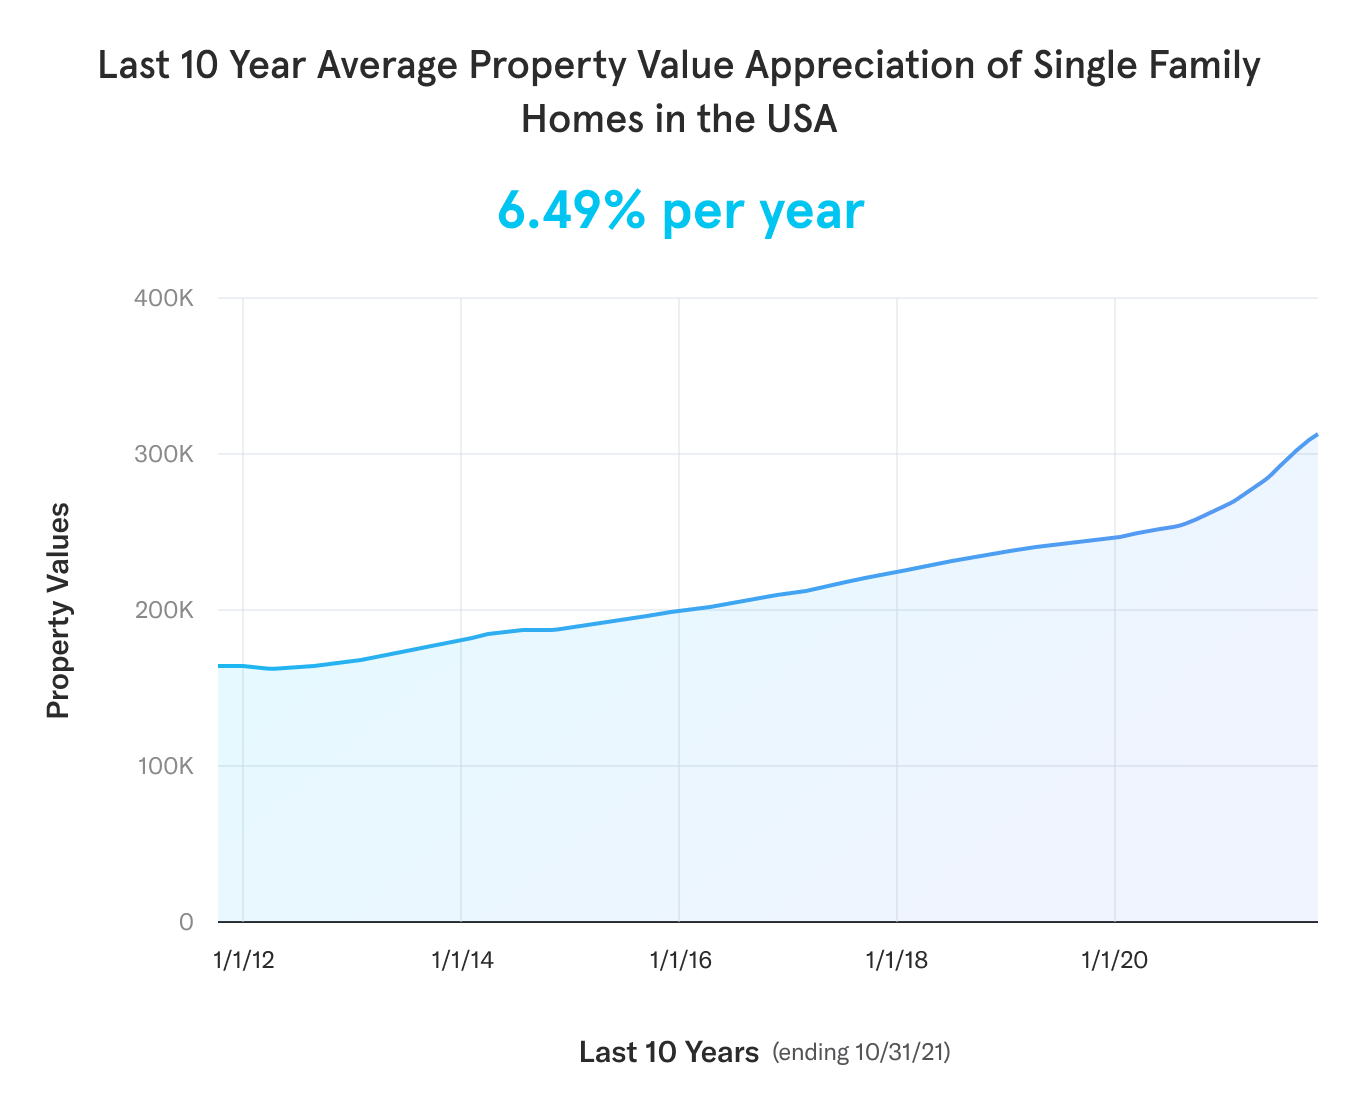
While this 6.49% appreciation is extremely impressive (especially since it excludes both the impact of financing on equity returns as well as the rental income) it is important to note that this assumes investors purchased these properties in 2011, right after the big real estate downturn of 2008-2010.
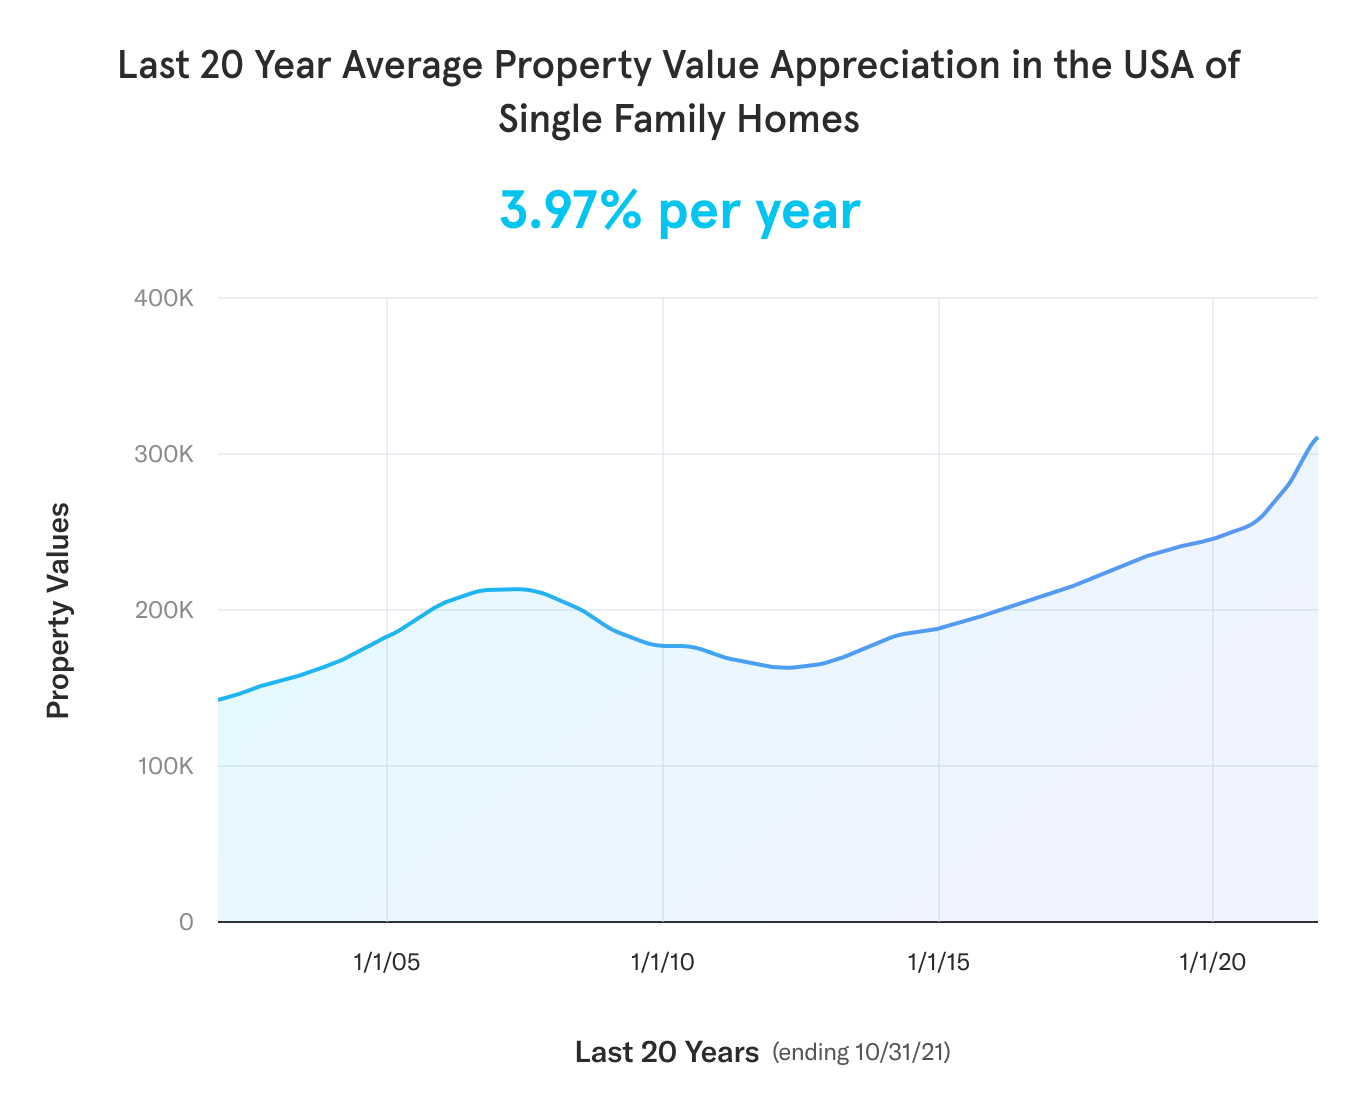
So let’s go ahead and extend the timeline to include the market crash of 2008 and cover a full 20 years. That way our data set includes a downward price cycle and shows us property value appreciation across a longer time period. We will use this 20 year dataset as our primary assumption moving forward. The data shows that the annual appreciation of property value in the USA across 20 years is 3.97% per year. As you can see from the graph, there were a few years where property values actually fell and took a while to recuperate.
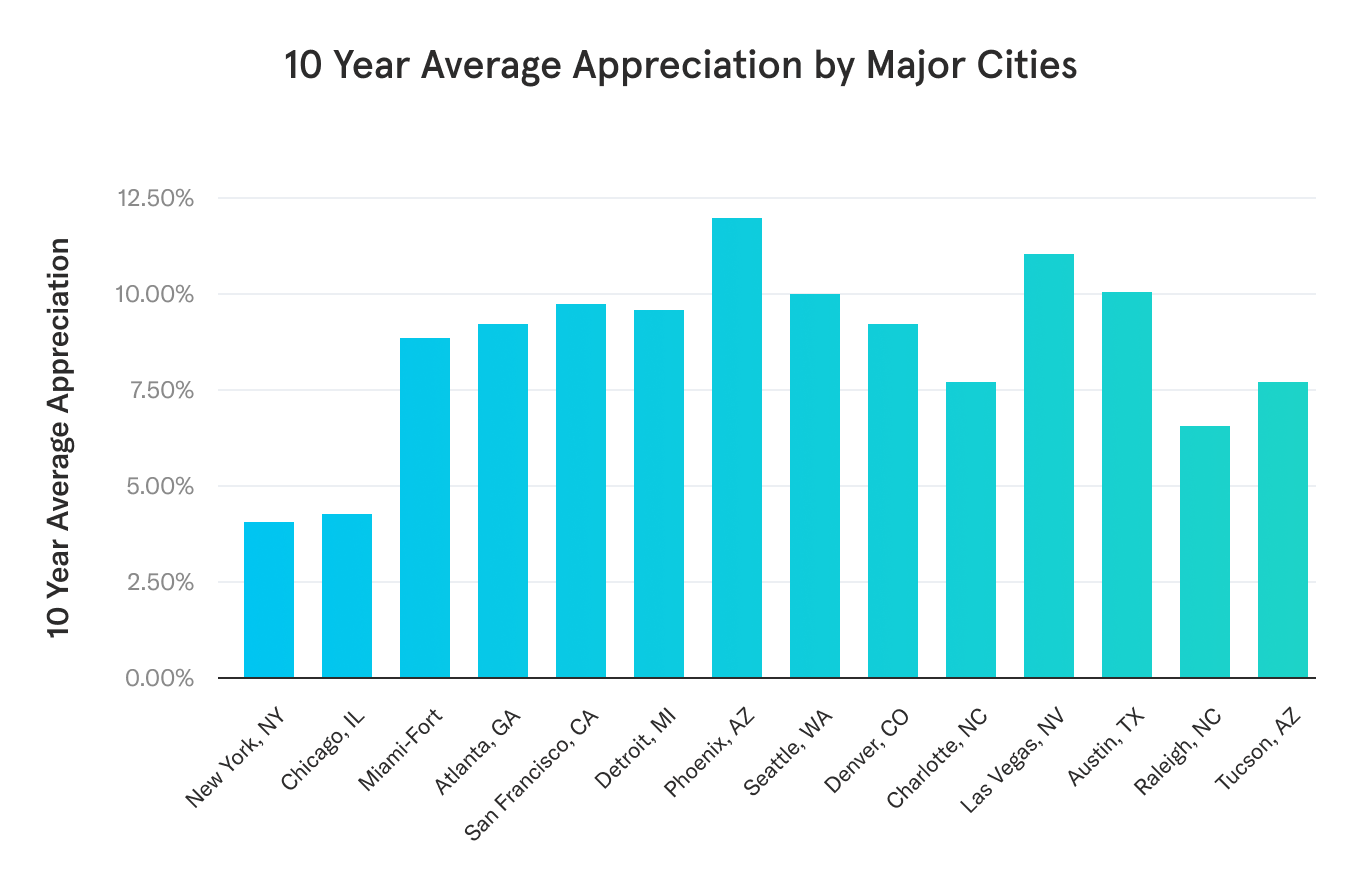
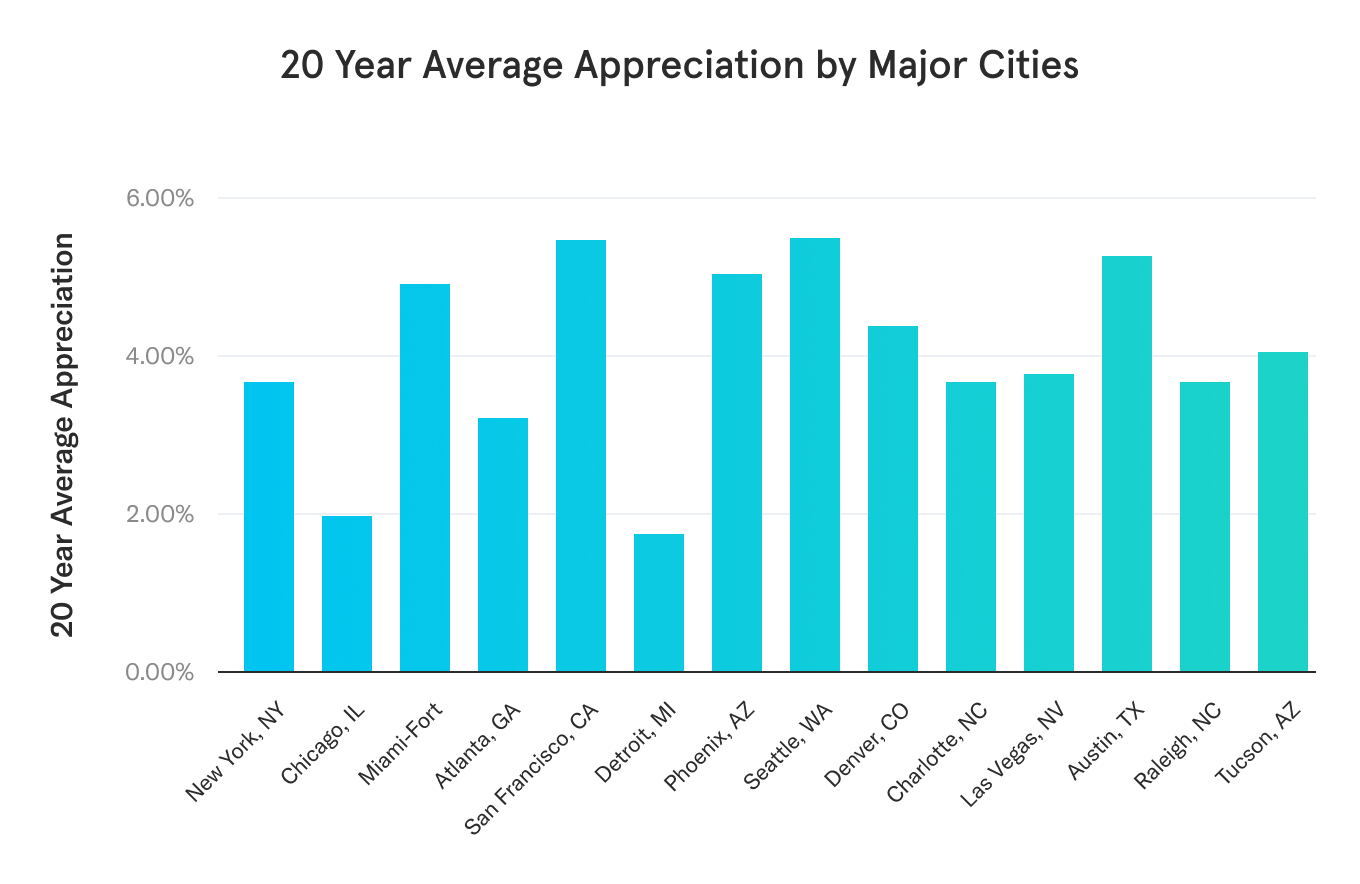
If we look at individual markets things get even more interesting as each market may perform much differently than the average across the country. Below we can see the 10 and 20-year property value appreciation returns for different markets across the USA. If a particular market has performed really well in the past, that doesn’t necessarily mean that those superior investment returns will continue in the future.
Mortgage Impact
Now that we have a better understanding of property value appreciation over the past few years, the next step is determining investment returns from equity growth. To understand equity growth, a critical piece of information is the size of the mortgage used to buy the investment property (otherwise known as leverage or debt).
In our article “Property Value Appreciation Drives Investment Returns More Than You Think,” you can read more about the impact of a mortgage on returns. Still, the high-level summary is that using a mortgage to purchase a home will magnify the effect of property value changes on your investment returns.
Let’s review a quick example. Assume an investor purchases a property for $100,000, pays $20,000 in cash, and takes out a mortgage to pay the remaining 80%. If that property value appreciates 5% in one year, then the new value of the property is $105,000. The mortgage loan is still $80,000, but the investor’s equity in the property is now $25,000, resulting in an annual return on investment of 25%. Of course, this magnifying effect goes both ways. If the property value were to go down 5%, the investment would be worth 25% less. That’s the power of adding a mortgage to an investment property investment.
What is a typical mortgage size when buying an investment property? This is a highly personal decision. Some people are more risk averse and avoid debt altogether, even if that means lower potential returns. Other people are more risk tolerant and will use the maximum amount of debt, using debt to purchase up to 80% of the purchase price.
Here at Arrived, we sometimes purchase homes using a 65% mortgage, meaning that our investors are collectively paying 35% of a purchase price in cash. We find that this 65% debt is common with investors, and we believe 65% can deliver increased potential returns while not adding too much additional risk. So for the remainder of the study, let’s assume properties have the same 65% debt as some Arrived properties.
Historical Equity Value Growth
Now that we have historical data for property value appreciation and an assumption on the mortgage amount, let’s take a look at what those two would mean for the investors’ equity growth and returns.
Let’s use the average property value appreciation over the last 20 years so that we can be more conservative and include the 2008 real estate downward cycle. Assuming this 3.97% annual property value appreciation and a 65% mortgage, the resulting equity returns would be magnified to 6.1% per year. That means that for every $100 invested, the equity value created each year is $6.10.
Below we can see a chart of the equity growth percentage over a 10-year investment.
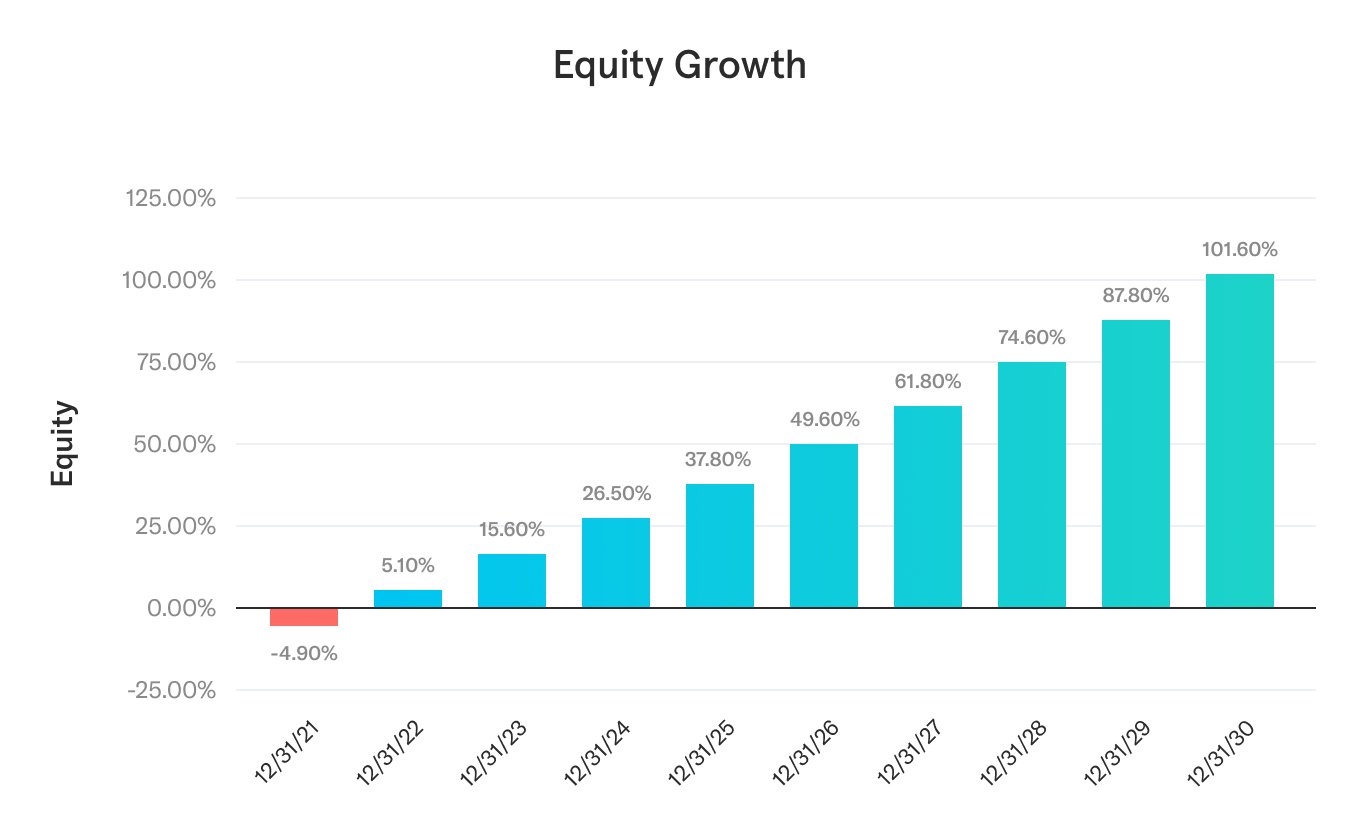
For the above annual return calculations, we are also adding assumptions around real estate transaction costs & fees so that those are taken into account when calculating the final investment returns. We are assuming that on the initial investment, there are upfront transaction / other costs of 6% and selling costs of 6% when the property is sold. In this example, we are also assuming that the investment will be held for 10 years.
As an additional data point, if we had used the average property value appreciation over the last 10 years (6.49%), the resulting equity returns would have been 10.5% per year. Since that 10.5% equity return excludes the rental income, that shows what an exceptionally terrific investment rental homes have been over the past 10 years.
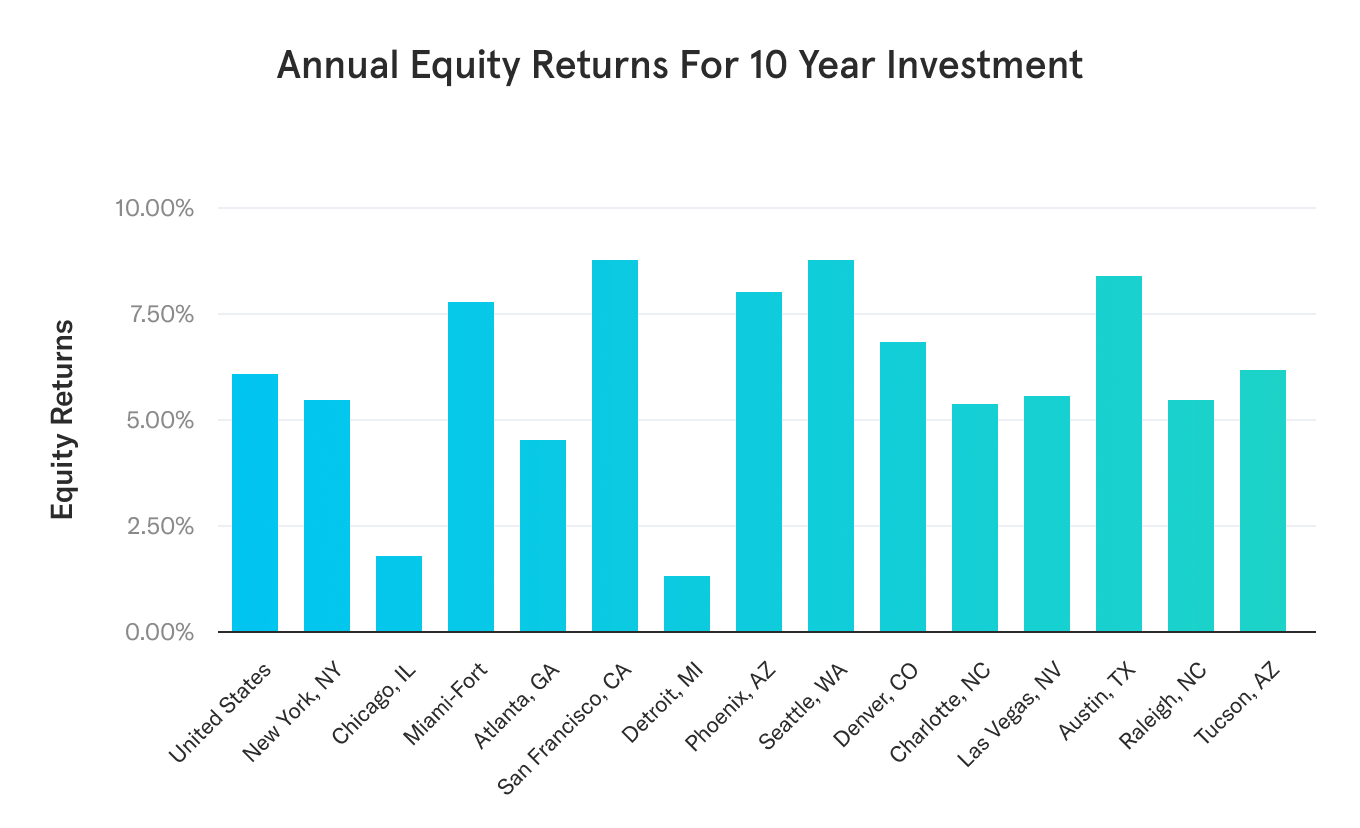
Below we can see the annual equity returns for individual cities after taking into account fees and the mortgage. This disparity in returns between markets is why picking the right markets with the most upside for investment potential is important.
2) Rental Income
Historic Data
Now that we have a good understanding of the historical returns from property value appreciation, below we will look at some historical data around rental income and the resulting investment returns. Since there isn’t great publicly available data on rental property rental income, we will use historical data from the Arrived rental property portfolio.
Every quarter Arrived releases an in-depth report that reviews the financial performance of all properties in the Arrived rental property portfolio. If you are interested in getting a deeper understanding of a rental property income statement and the operating expenses that go with it, you can check out our Q2 report here and our Q3 report here.
We see that 5.6% is the average annualized dividend paid out on existing Arrived properties in 2021 when adjusted for compounded annual growth. That means that for every $100 invested, Arrived investors would receive cash payments of $5.60 on a yearly basis from rental income.
Again it is important to note that past performance is not indicative of future returns, and it is possible that new cities & rental homes we expand into will have lower rental yields than our current portfolio.
Calculation Methodology: We used annualized dividend yields based on the Arrived property Q2 and Q3 dividend payments. That includes 2 quarters of payments for the first 6 properties and 1 quarter of payments for 22 properties. While these dividends paid have actually averaged 6.1% on an annualized basis. That means for every $100 invested, you would have received $6.10 of annual dividends. However after compounding it and considering the time value of money, over a 10 year period it will result in a compound annual growth rate of 5.6%. The result may not seem intuitive since we start at a 6.1% dividend, but the effects of compounding at a 4% rate bring this number down slightly over a long period of time.
Below are the yearly dividends over time for a property with a $350,000 value. You can see the dividends grow along with the rent payment’s increase.
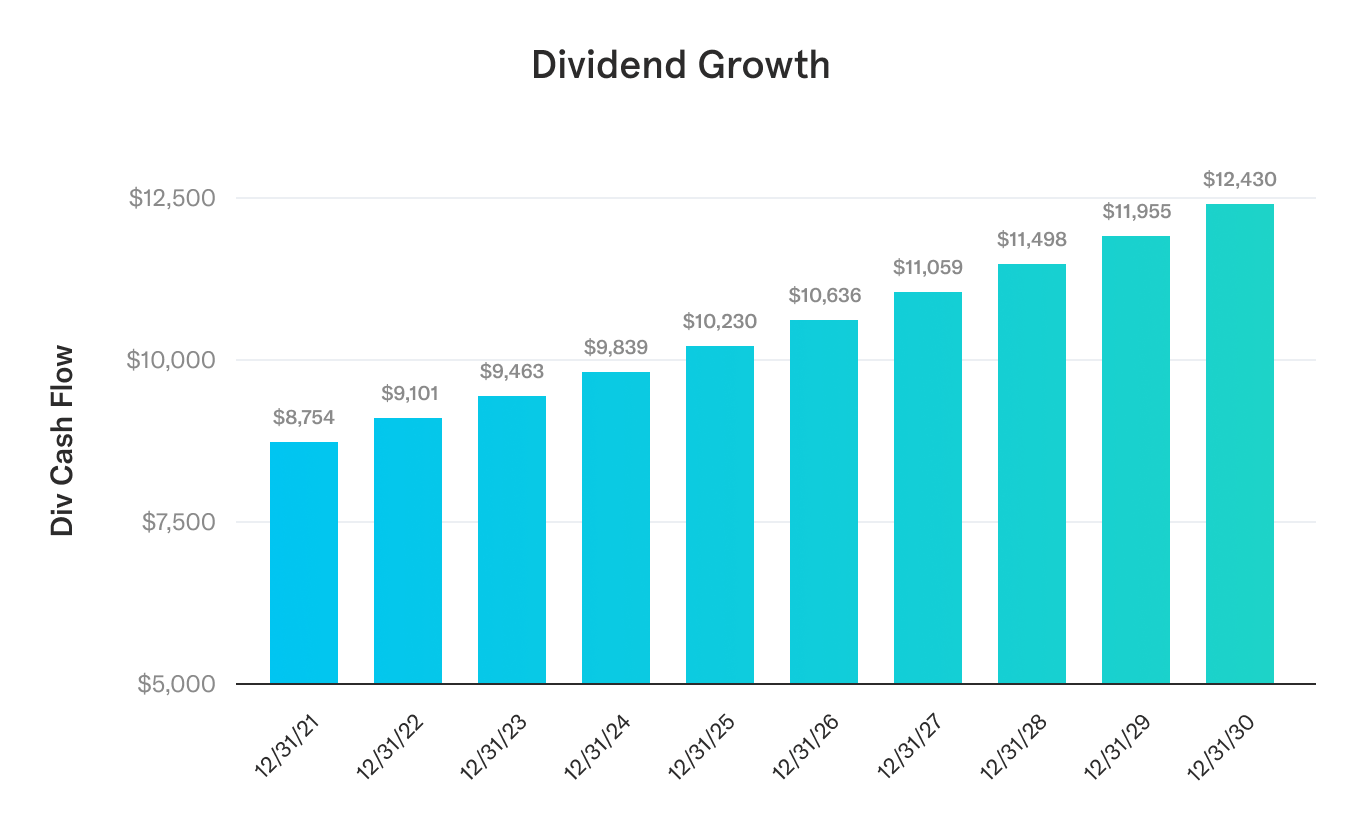
Below we can see a full breakdown of our 28 rental properties and their corresponding annual dividend calculated from Q3 2021 dividend payments.

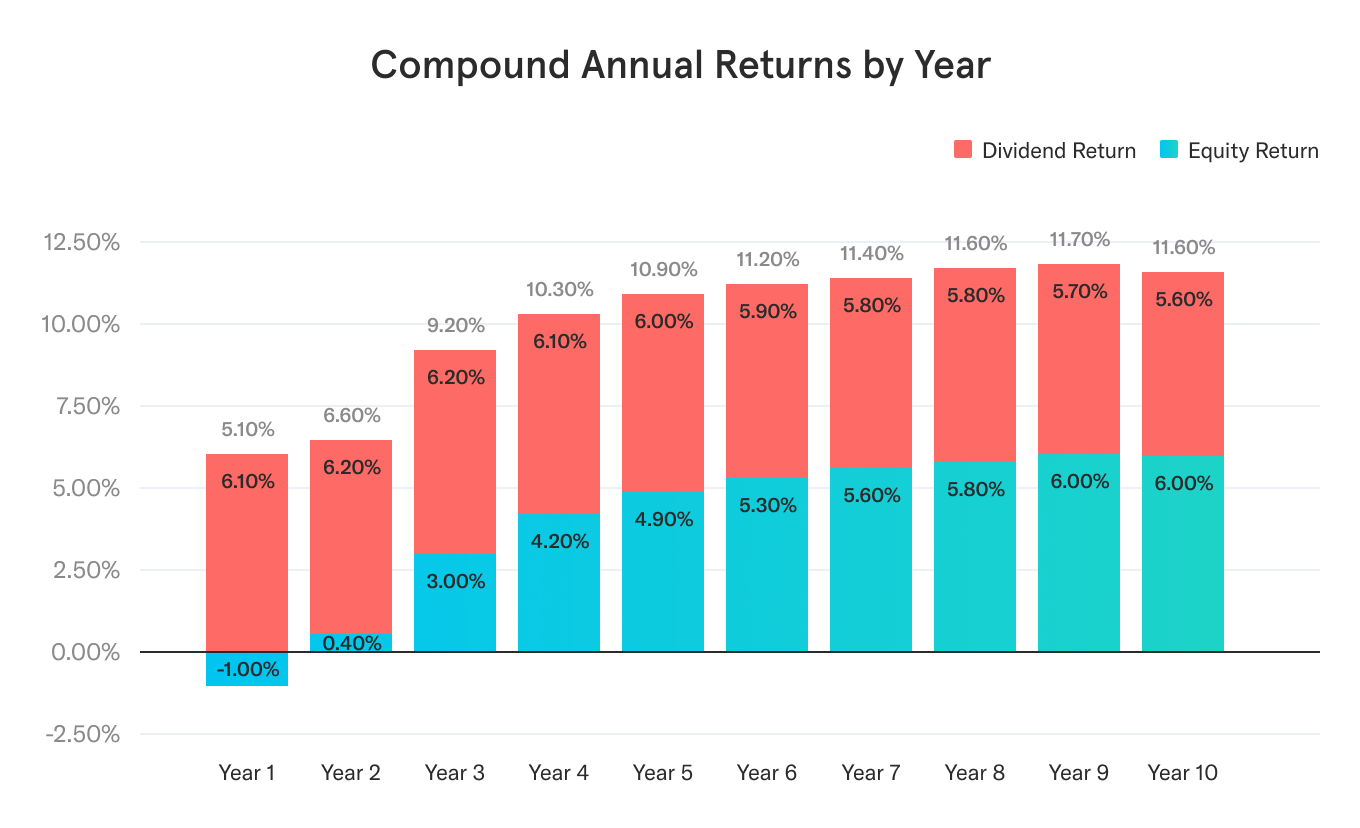
Total Returns
So if we then combine the 6.1% property value growth returns and the 5.6% dividends from rental income in 2021, our findings show an 11.7% annual return on investment over a 10-year holding period. This utilizes the average property value growth rate in the US for the past 20 years and we are assuming that on the initial investment, there are upfront transaction / other costs of 6% and selling costs of 6% when the property is sold.
To determine the total annual return on investment, we utilized the Internal Rate of Return (IRR) methodology, which calculates the rate at which all future cash inflows are discounted to be equivalent to the present-day cash outflow. So the 11.7% is a compounded annual return over the 10 years of investment.
If we were to take the average property value appreciation from the last 10 years of 6.49% (instead of the 20-year average), then the annual return on investment actually increases to 15.8% per year. As you can see, rental properties have been a terrific asset class this past decade.
How do Rental Property Returns Compare to Other Asset Classes?
Now that we have data around historic investment returns for the rental properties, let’s go compare them to one of the most popular investment options: a diversified basket of US stocks.
We found that the annualized return for the S&P 500 was 9.43% over the last 20 years (ending 10/31/21). This data represents the compounded annual growth rate with dividends reinvested, which was pulled from this website that uses data from Robert Shiller.
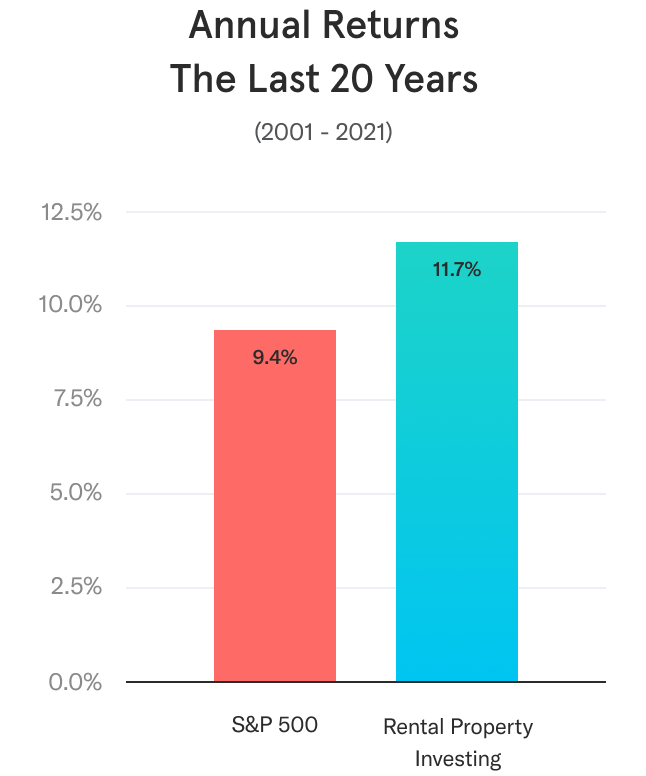
In this chart above we compare the historical annual returns from the S&P 500 with the rental property asset class. As you can see, while the S&P 500 has delivered very strong investment returns across 20 years, the rental property asset class has actually outperformed the S&P 500.
Wrap Up
After analyzing the historical data on rental property investing, we found that returns were both strong and consistent across property value growth and rental income. This seems to validate why year after year Gallup polls consistently find that Americans view real estate as the best long-term investment.
While investing in real estate has historically delivered strong returns, it can be difficult to get started. Traditionally investors need time, expertise, and high amounts of capital. Here at Arrived, we have built a modern investment platform where anybody can start investing in rental properties and building wealth in under 5 minutes.
SIGN UP TODAYCitations:
The opinions expressed in this article are for general informational purposes only and are not intended to provide specific advice or recommendations for any individual or on any specific security or investment product. The views reflected in the commentary are subject to change at any time without notice. View Arrived’s disclaimers .