
Welcome to the latest installment of the Arrived property financial review! In Q4 2021, investors owned 28 properties for a full 3 months of rental operations. Our previous financial reviews can be found here for Q3 2021 and here for Q2 2021.
Properties purchased by investors December 2021 onward will pay out their first dividends in April and will cover Q1 2022 rental income.
As a refresher, real estate investors earn financial returns from dividends and property appreciation. We’ll review the financial statements for each property showcasing the operations, and then include the Zillow Zestimates as a rough gauge of appreciation.
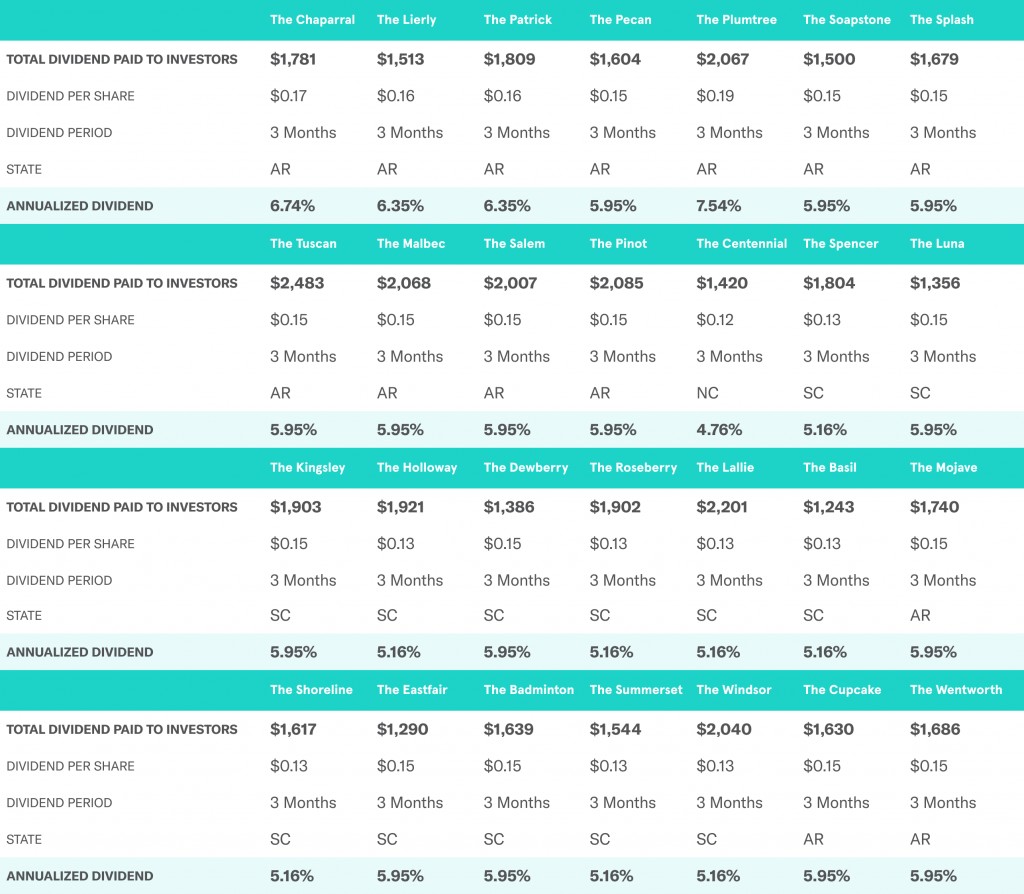
The big highlight for the quarter? The 28 properties paid out dividends from $0.12 to $0.19 per share. Annualized over a full year, that translates to a dividend rate of 4.76% to 7.54%.
To get a better picture, we can look at the annualized dividend over the last several quarters. 22 properties have now paid out 2 dividends, and 6 properties have paid out 3 dividends. Annualizing the 2-3 dividends over a full year results in a dividend range of 5.1% to 7.2%.
Of course, this is just the cash income that ends up in investors’ pockets. As the housing market continues to appreciate, the value of Arrived shares increases too!
We’ll review the dividends and appreciation at a high level before diving into the detailed financials. This article has the financials for all 28 properties that had rental operations in Q4. You can also view them at the bottom of each property’s page.
Cash Dividends Overview
With savings accounts and CDs paying virtually no interest, investors are interested in assets that can provide cash returns.
The Arrived Q4 2021 dividends, paid out in January 2022, were an excellent way for investors to earn those elusive cash yields. The properties performed well overall, collecting more rent from tenants than the property expenses, and distributing the difference to investors.
The Q4 dividend ranged from $0.12 to $0.19 per share depending on the property – an annualized rate of return of 4.76% to 7.54%. In total, we paid out $49,000 to investors!
A better way to analyze investment performance is to look at a longer returns history. Using the 3 quarters of dividend history that Arrived has paid, properties have paid out cash between 5.1% and 7.2%. The Arkansas and South Carolina markets have great cash flow, and keep in mind that other markets may have lower cash yields, but potentially more appreciation potential.
That means that a $5,000 investment would have earned $255 to $360 in annual income.
Here’s the breakout of dividends for each property.
Income earned by investors should be reported on your tax return. However, the amount of taxable income is much lower than the dividends paid out. Check out our 2021 tax analysis to see how more about how depreciation and other real estate tax deductions lower the amount of taxable income for investors.
Appreciation Overview
Real estate investors value the immediate cash dividends, but are also focused on the long-term appreciation potential of a property.
There’s many different ways to estimate the value of a property. For simplicity, we’ll use the Zillow Zestimate as an indicator for how the properties are performing.
The final appreciation value will come when there’s a firm offer for a property, but since these properties will be held for several years, there’s plenty of time for the property value to continue to appreciate.
Of course, when analyzing appreciation, it’s important to factor in the leverage from the mortgage. When debt is used in an investment, it can magnify the financial returns to be significantly higher than simply comparing the purchase price. To get an idea of how this works, check out this article.
Here’s a summary table showing the price Arrived investors purchased each property at, the current Zestimate (as of 1/13/22) and the length of time investors have owned the property.
Overall it appears that property values have increased, which is fantastic! This is just one estimate of property value, but it’s an indicator that the investments will perform well.

Property Financials
Rental properties earn profits by collecting rent and subtracting the expenses. Here we’ll review the combine performance of all 28 properties. The financials for each individual property can be found on the bottom of that property’s page.
Now let’s check out the detailed financials for each property. As a brief review, each property’s page has the historical financials at the very bottom. Here’s the combined financials for all 28 properties:

Rental Income
At the end of Q4, 27 of the 28 properties were rented. The Mojave, The Wentworth, and The Cupcake were only rented for part of the quarter. All 3 were purchased at the end of September, and had tenants in the property by November 1st.
Over the full 3 months, the properties collected gross rents of $154,194. That works out to $5,507 per property, or $1,836 per property per month. This is strong performance, and a great job by our asset management team!
The holiday season is the toughest time to find tenants, so it was key to have these properties occupied and operational before the seasonal slowdown started at Thanksgiving.

Operating Expenses
Operational expenses are all of the nitty gritty costs to owning a property – repairs & maintenance, property taxes, insurance, and property management.
Most operational expenses come when the property is vacant, for 2 reasons. One is that there’s no tenant to pay the utilities bills, and the larger reason is that we’re often doing cleaning, repairs, and improvements during this time before a new tenant moves in.
With almost all the properties rented for the duration of Q4, there were very little operational expenses. The bulk of these costs were known recurring expenses, like property taxes and insurance.
The average monthly operating expenses were $429 per property per month. Dividing the operating expenses by the rents collected for the properties gives an operating expense ratio of 23%. This is well below the industry standard, but it makes sense since there was very little vacancy during this period.
Net Operating Income
The net operating income is the performance of an asset before looking at the how the financing costs impact the bottom line. The Net Operating Income, or NOI, is the rent minus the operating expenses.
The total operating expenses were $36,016 for the 28 properties, and the total rent collected was $154,194, so the aggregate NOI for the full Arrived portfolio was $118,178.
Basically the average property earned rent of $5,507 and paid $1,286 expenses, resulting in a quarterly net operating income of $4,221.
Of course there is variance in the performance of each property, and financial results will be dependent on the specific performance of the property you invest in. Arrived generally recommends investors diversify across several properties.
Financing Costs
After determining the Net Operating income for a property, we’ll need to subtract the costs associated with the financing.
The first one is the interest expense and the loan fees. The monthly interest payment is quite low for these properties since all of our mortgages are interest-only loans. This is done to ensure that investors can get higher cash flow!
This section also includes the costs for annual audits and tax reporting. The financing costs were higher than Q3 because of these annual costs. Going forward we’ll accrue these across the year to show more consistent financing costs.
A typical Arrived property had interest and loan fee expenses of $2,594. Again this is high for this year since it was a partial-year and the properties each had costs for tax preparation and audits. Going forward this cost will be accounted for a little bit each quarter.
Arrived AUM Fee
The other financing component is the Arrived AUM fee. The fee is 1% of the equity invested by investors, paid out of the property’s income each quarter.
The 28 properties paid a total of $9,438 in AUM fees to Arrived, or an average of $112 per property per month.
Allocation to Cash Reserves
For each property, Arrived maintains a cash reserve balance that can be used for unforeseen expenses. Because of this cash reserve, Arrived will never ask for more money from investors for a fully funded property. In the event of a big ticket expense, we’ll use the funds from the cash reserves, and could borrow money from Arrived’s corporate entity if absolutely necessary.
When we analyze the property performance each quarter, most of the cash generated by the property is paid out to investors. However, we’ll take some of the profits and set it aside to grow the cash reserves. This way investors are protected and assured knowing there are plenty of funds ready in case of a rainy day.
Total Dividends
After saving some of the cash flow for later, the rest is all distributed to investors! The culmination of the Q4 finances is that we were able to pay out a grand total of $48,919 to investors.
Annualizing the quarters dividend provides a range of 4.76% to 7.54%.
To date, Arrived has paid out a grand total of $95,655 from the Q2 – Q4 2021 operations, representing annualized returns of 5.1% to 7.2%. Our favorite days of the year are the ones where we get to send money to your bank account!
Investors who purchased shares in December 2021 through March 2022 will receive their first dividends in April, after we finish closing the books on Q1 2022. April can’t come fast enough!
With tax season around the corner, check out our 2021 tax analysis to see how Arrived investments performed in 2021 after factoring in all the applicable real estate deductions.